
Remember me

In total, 908 patients were identified that received ViV-TAVR between 2005 and 2022. Of these, 172 had no documented prescription for any antithrombotic therapy. These were excluded from further quantitative analysis. Of the remaining patients, 286 (38.9%) received DOACs, 99 (13.5%) received VKAs and 351 (47.7%) received APT. In the DOAC group, apixaban was the most common DOAC (60.5%) followed by rivaroxaban (22.7%). Approximately half of the DOAC patients (51.0%) received concomitant APT. In the VKA group all but one patient received phenprocoumon. The other patient received warfarin. Of the VKA patients, 47.5% of patients had a concomitant prescription for APT. In the APT group, 51.0% of patients had a prescription for ASA and 88.3% of patients had a prescription for clopidogrel. Subsequently, 41.6% had a prescription for dual antiplatelet therapy. The mean age was 77.4 ± 8.4 years, 79.4 ± 6.5 years and 78.4 ± 6.4 years for the APT, DOAC and VKA groups, respectively. Atrial fibrillation or flutter was more common in patients receiving DOACs (88.1%) or VKAs (80.8%) compared to patients receiving APT (42.7%). Congestive heart failure was also more common in patients receiving DOACs (41.6%) and VKAs (40.4%) compared to patients receiving APT (28.8%). Baseline characteristics are summarized in Table 1.
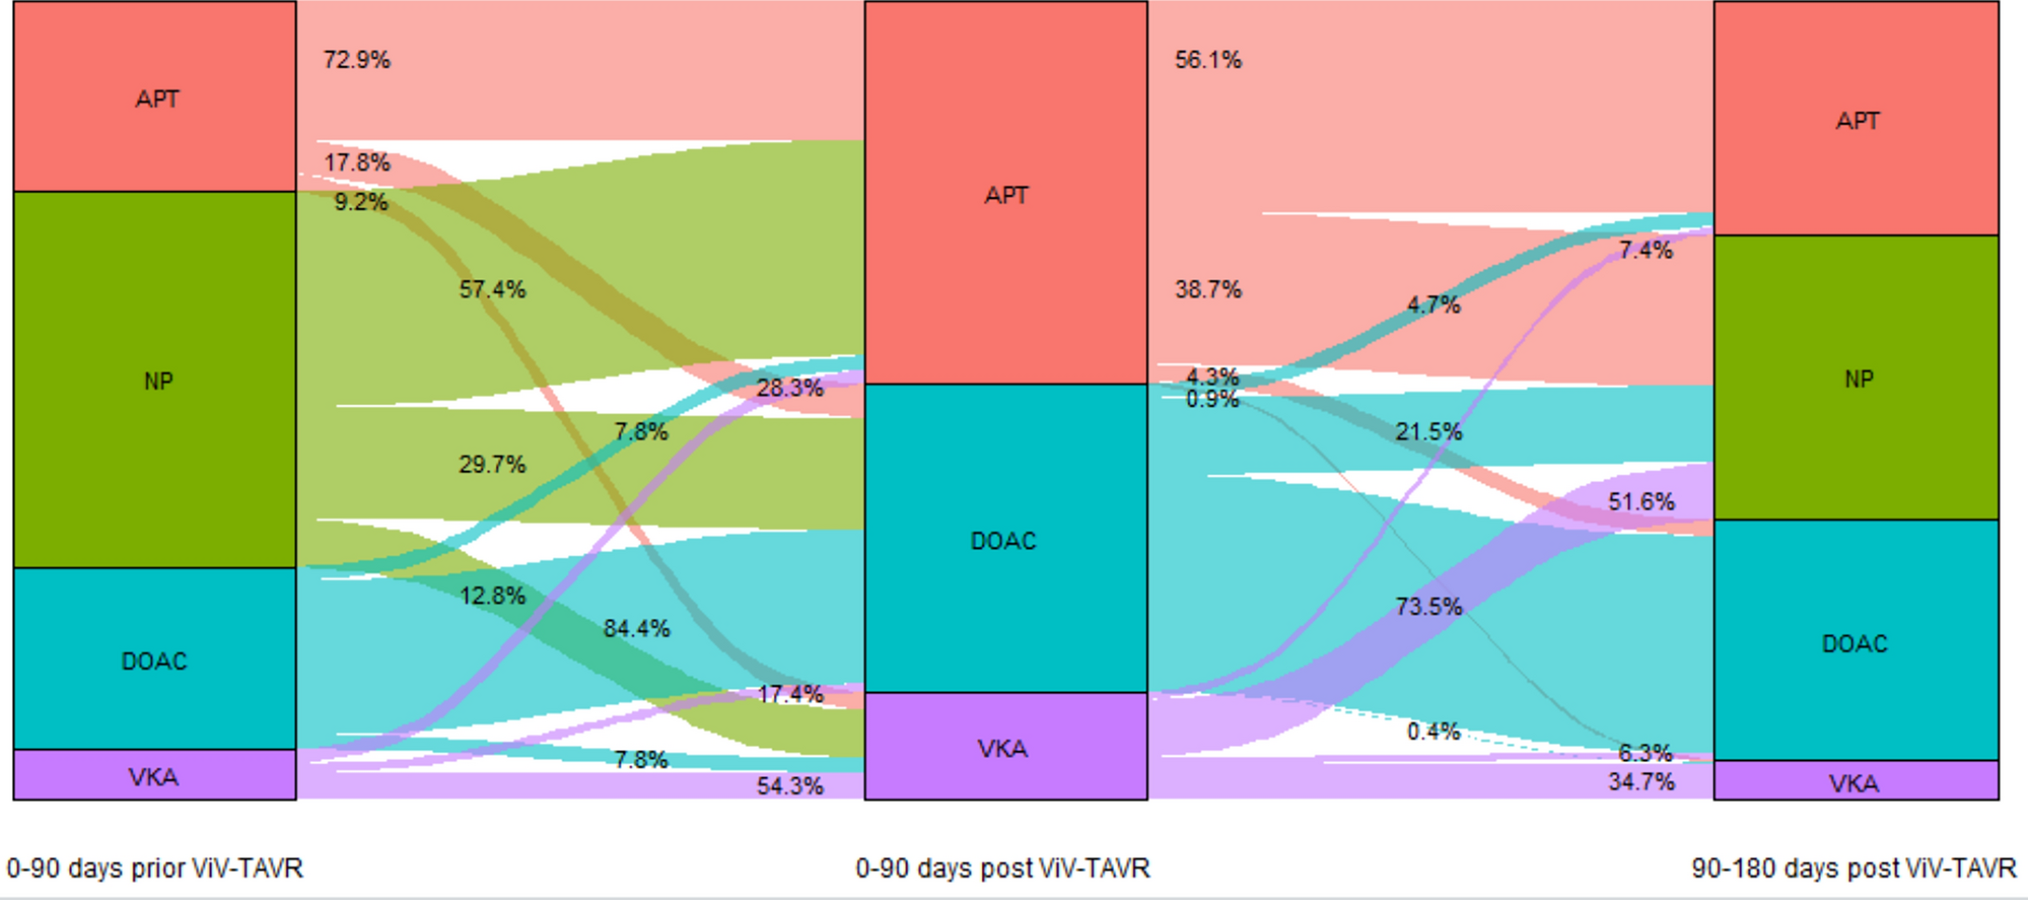
Table 1 Baseline characteristics of all patientsAntithrombotic strategies following ViV-TAVRFollowing ViV-TAVR, most patients received APT (47.7%), followed by DOACs (38.9%) and VKAs (13.4%). The majority continued the antithrombotic treatment they were prescribed in the 90-day period prior to ViV-TAVR. Of the patients who had no prescriptions for antithrombotic therapy prior to the index procedure, most patients were prescribed APT (57.4%) after ViV-TAVR followed by DOACs (29.7%) and VKAs (12.8%). In the VKA group, 51.6% of patients had no follow-up prescription for antithrombotic treatment three months after the procedure. In the APT and DOAC groups, 38.7% and 21.5% of patients had no follow-up prescription respectively. Only a few patients were switched from DOAC to VKA or vice versa und only approximately 5% of patients were switched from APT to OAK with DOAC or VKA after three months. Figure 1 summarizes the prescriptions patterns and changes prior to and after ViV-TAVR.
Fig. 1
Alluvial plot of antithrombotic drug prescriptions prior to and after ViV-TAVR. APT antiplatelet therapy, DOAC direct oral anticoagulant, NP no prescription, ViV-TAVR valve-in-valve transcatheter aortic valve replacement, VKA vitamin K antagonist
Efficacy endpointsThe incidence of the composite endpoint of all-cause mortality, SSE and mechanical complication of heart valve prosthesis at 1 year was 20.8% in the APT group, 20.3% in the DOAC group and 25.3% in the VKA group (Fig. 2). There was no statistically significant difference between groups in both the univariable and multivariable analyses (Table 2).
Fig. 2
Kaplan–Meier-plot of cumulative incidence all-cause mortality, stroke and/or systemic embolism and mechanical complication of heart valve prosthesis
Table 2 Results of the univariable and multivariable Cox proportional-hazard regression model analysesThere was also no difference between groups at 5 years of follow-up (supplementary Table S2 and Figure S1). Contrastingly, in patients with index procedure before 2015, patients with prescriptions for VKAs had a significantly higher incidence of the composite endpoint while in the subgroup of patients with index procedure after 2015 there was also no difference in the incidence of the cumulative endpoint between groups (supplementary Figure S2 and Tables S3 and S4). Baseline characteristics of both groups are summarized in the supplementary appendix.
During the first year of follow-up, 7.9% died in the APT group, 8.7% in the DOAC group and 6.1% in the VKA group (Fig. 3A). These differences were not statistically significant (Table 2). Compared to the APT (12.8%) and VKA (15.2%) groups, SSE occurred numerically less often (9.8%) in the DOAC group (Fig. 3B). This effect was not statistically significant in the univariable (APT vs. DOAC: HR 0.76, 95% CI [0.47, 1.22], DOAC vs. VKA: HR 1.47, 95% CI [0.79, 2.76], Table 2) and multivariable analyses (APT vs. DOAC: HR 0.58, 95% CI [0.32, 1.06], DOAC vs. VKA: HR 1.42, 95% CI [0.75, 2.69], Table 2).
Fig. 3
Kaplan–Meier-plots of cumulative incidence for A all-cause mortality, B stroke and/or systemic embolism, C mechanical complication of heart valve prosthesis and D intra-, extracranial or gastrointestinal bleeding
Mechanical complications of heart valve prosthesis occurred statistically significantly more frequently in the VKA group compared to the APT group (8.1% vs. 3.1%, HR 2.65, 95% CI [1.07, 6.59], p = 0.03, Table 2). This effect was not significant in the multivariable analysis (HR 2.67, 95% CI [0.83, 8.60], Table 2). Mechanical complications were similar in the APT group compared to the DOAC group (3.1 vs. 3.8%).
Safety endpointsIntra-, extracerebral or gastrointestinal bleeding occurred in 35.6% of patients in the APT group, 36.7% of patients in the DOAC group, and 39.4% of patients in the VKA group (Fig. 3D). Statistically, there were no significant differences between groups in both the univariable and multivariable analyses (Table 2).
Subgroup analyses ASA mono vs. DAPT with ASA and clopidogrelSupplementary Table S6 summarizes the baseline characteristics of the subgroup of patients with ASA monotherapy and DAPT with ASA and clopidogrel. 33 patients were treated with ASA mono and 137 with ASA and clopidogrel. DAPT patients were slightly younger and less often had congestive heart failure. The rate of atrial fibrillation was 39.5% in the ASA mono and 35.0% in the DAPT group.
There was a trend towards an increased rate of the composite endpoint of death, stroke and/or systemic embolism and mechanical complication of heart valve prosthesis in the ASA mono group (36.4% vs. 21.2%, univariable HR 0.53, 95% CI [0.27, 1.03], p = 0.06, Supplementary Table S7). This was driven by a statistically significantly higher rate of SSE in the ASA mono group (27.3% vs. 12.4%, univariable HR 0.42, 95% CI [0.19, 0.95], p = 0.03, Supplementary Table S7). All other endpoints were not statistically significantly different between both groups (Supplementary Table S7).
Subgroup analyses stratified by need for oral anticoagulationOf the patients without the need for oral anticoagulation, 201 (79.1%) patients received APT, 34 (13.4%) received DOACs and 19 (7.5%) received VKAs. Baseline characteristics for the subgroups with and without indication for OAC are summarized in Supplementary Table S8. The composite endpoint occurred numerically albeit not statistically significantly more often in the VKA group (26.3%) compared to the DOAC (17.6%) and APT (18.9%) groups (Supplementary Table S9). This was mainly driven by a numerically higher rate of mechanical complications of heart valve prosthesis (VKA 10.5% vs DOAC 2.9% vs. APT 3.0%). Of the patients with an indication for OAC, 252 (52.3%) patients received DOACs, 150 (31.1%) received APT and 80 (16.6%) received VKAs. There was a trend towards less SSE in the DOAC group compared to the APT group (9.5% vs. 16.0%, univariable HR 0.59, 95% CI [0.34, 1.05], p = 0.07, Supplementary Table S10). There was no difference for all other outcomes.
Comments (0)