Data acquisition and processing
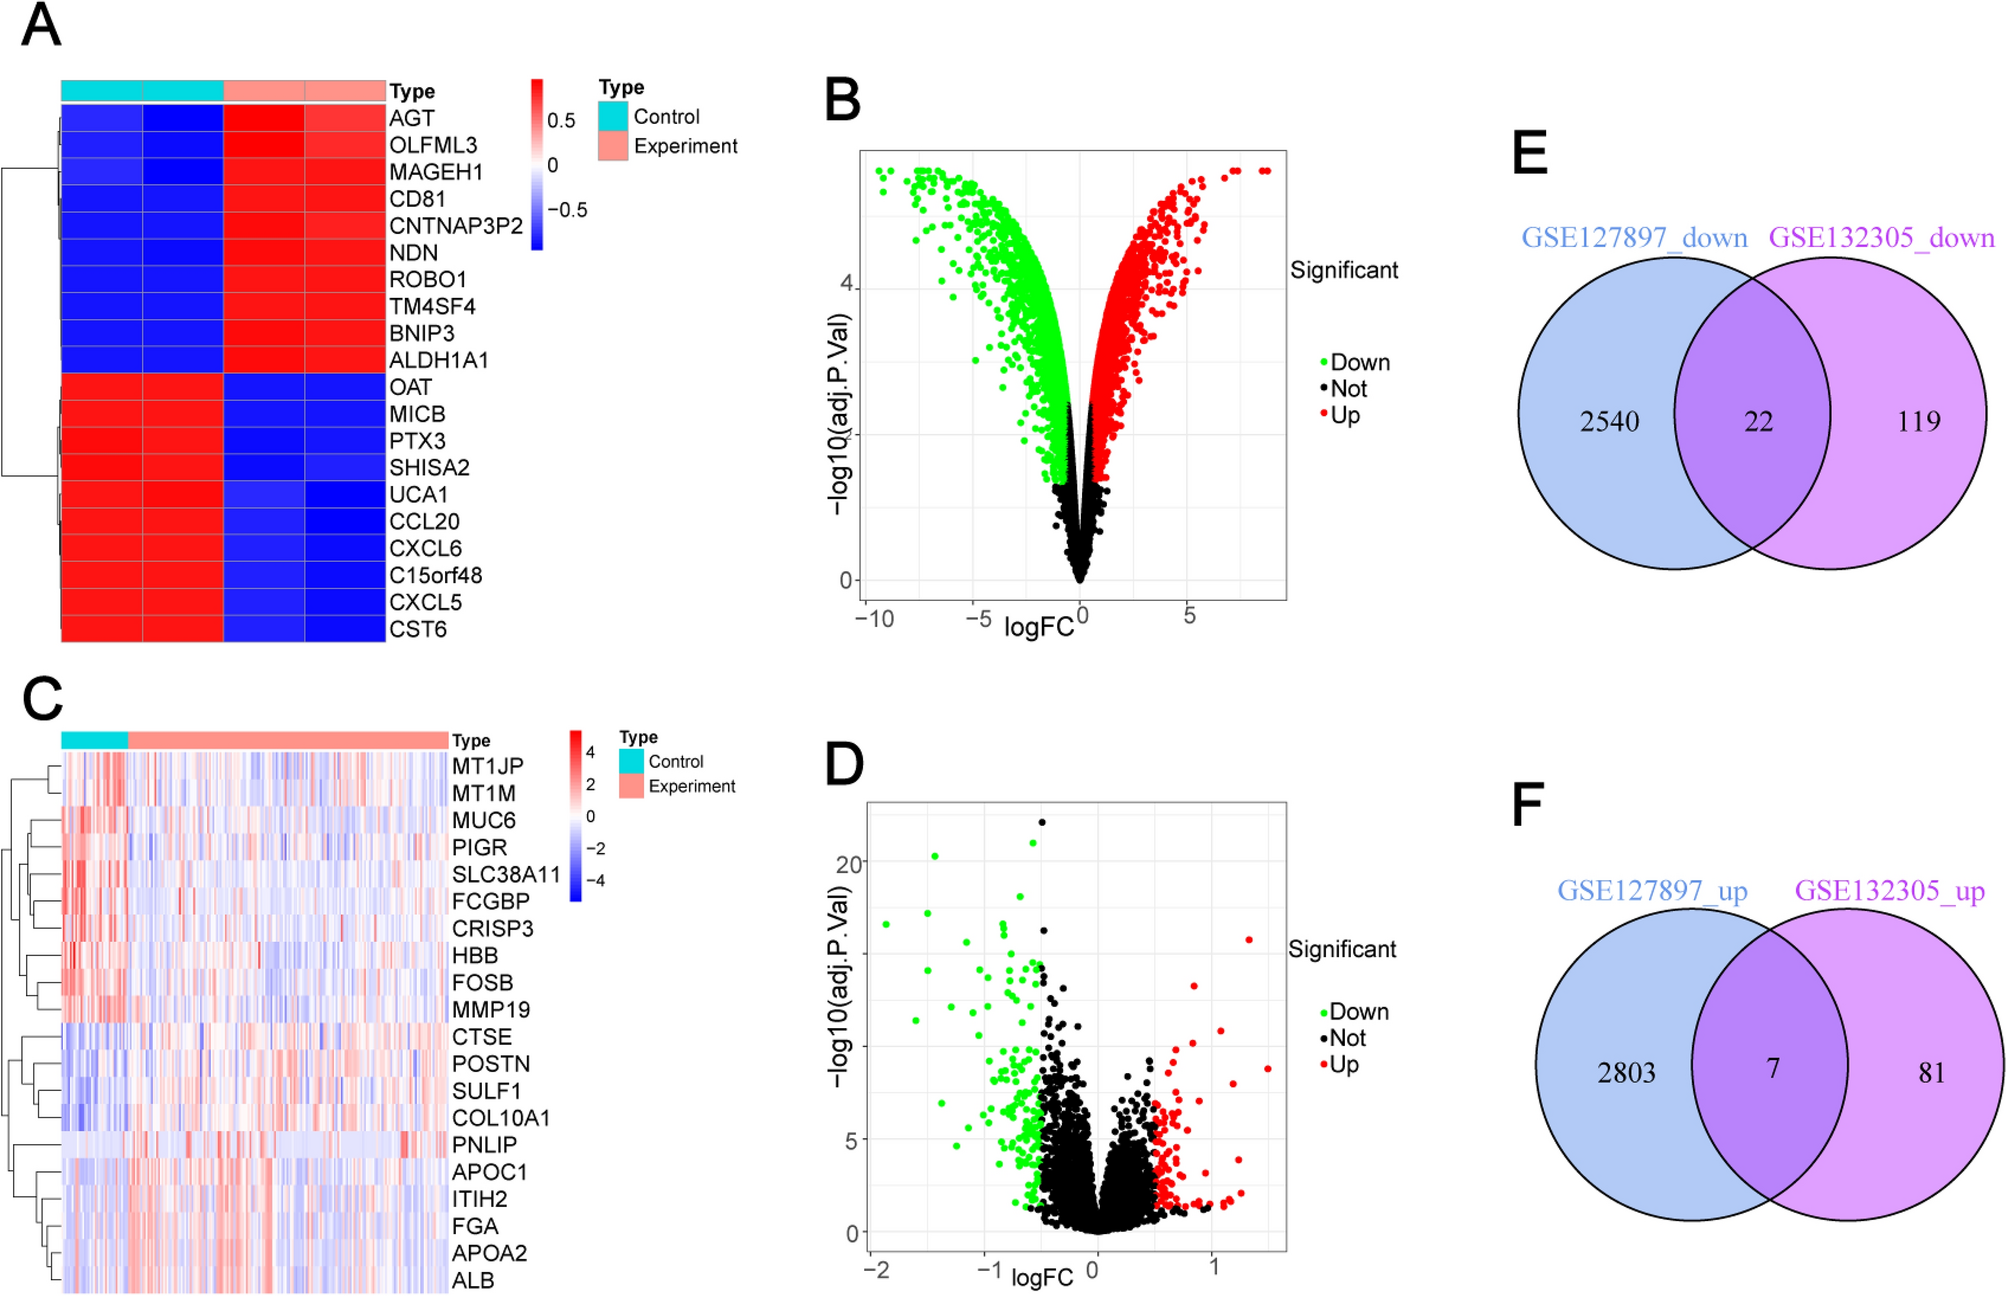
Geo datasets:search:cholangiocarcinoma/series (100)/expression profiling by array/homo sapiens (76)/GSE127897, GSE132305. It was downloaded from GEO (https://www.ncbi.nlm.nih.gov/geo/) on October 1st, 2024, and the clinical data and gene expression data were obtained using Perl. The differentially expressed genes of GSE127897 and GSE132305 were further analyzed using limma, pheatmap, and ggplot2.
Paraffin sections were obtained from 5 patients with gallbladder cancer who underwent surgery in the Affiliated Hospital of Bengbu Medical College from January 2022 to December 2023. All patients did not receive any treatment before operation (The Nevin staging method selected patients at stages I–II).The gallbladder tissue is sourced from patients who required surgical removal of the gallbladder due to cholecystitis between January 1, 2024 and December 31, 2024 (Randomly select five cases). All studies involving human specimens obtained the written informed consent of patients, and all animal experiments followed the guidelines of the China Animal Protection Association. This study was approved by the ethics committee of Bengbu Medical College [Ethical Approval (2023) No. 111/(2024)184)].
Hub gene screening and enrichment analysis
The intersection of differentially expressed genes from GSE127897 and GSE132305 was divided into high and low expression groups and visualized using the R language VennDiagram package version 4.3.2. The relationships between these genes were analyzed using the String database (https://string-db.org/) with a medium confidence level set at 0.150. Visualization was performed with Cytoscape version 3.9.1, and the top 10 Hub genes were identified using the cytohubba plugin. Finally, Gene Ontology (GO) and Kyoto Encyclopedia of Genes and Genomes (KEGG) enrichment analyses for the Hub genes were conducted using the clusterProfiler, enrichplot, and ggplot2 packages to explore the potential biological functions of these distinct genes.
Lentiviral transfection
Cell source: The cell line used in this research is the human gallbladder cancer cell line (NOZ), which was purchased from the iCell Bioscience Inc. (Shanghai, China). Cultivation conditions: Cultivate in a carbon dioxide incubator at 37 °C using 1640 medium containing 10% fetal bovine serum. Cell preparation: When the cells grow to 80% density, prepare a cell suspension with a concentration of 3–5 × 10⁴/ml, determine the grouping, and inoculate it in a six-well plate and then continue to culture for 16–24 h. Infection process: Based on the MOI values and virus titers of each cell line, corresponding amounts of virus and infection enhancer are added. After continuous infection for 12–16 h, the culture medium is replaced with conventional medium for further cultivation. Calculation formula: Virus volume = (MOI value x number of cells) / Virus titer. Observation and screening: 72 h after infection, the transfection efficiency was observed under a fluorescence microscope, and uninfected cells were screened using puromycin. Cell fluorescence intensity was determined by taking photos. The virus test kit was purchased from Shanghai Jikai Gene Co., Ltd. The gallbladder cancer cell line (NOZ) groupings include THBS1-OE group (THBS1 overexpression group), THBS1-NC group (THBS1 empty vector transfection control group), and untreated NOZ cells as the control group.
Real-time PCR
Total RNA was extracted from cells using Trizol reagent and reverse transcribed into cDNA. The reaction conditions are as follows: denaturation treatment is carried out at 95 °C for 40 s, followed by annealing and elongation reaction at 60 °C for 30 s, for a total of 40 cycles. The THBS1 primer sequence (from 5ʹ to 3ʹ end) is as follows: forward chain AGATCCCATCGCAAAGG and reverse chain TCACCACGTGTCAAGGG. The U6 primer sequence (from 5ʹ to 3ʹ end) is as follows: forward chain CTCGCTTCGGCAGCACA and reverse chain AACGCCTTCACGAATTTGCGT.
Western blotting
After the cells have grown to about 80%, the protein is lysed and extracted. Protein quantification was performed according to the instructions of the BCA kit (Biyun Tian; Jiangsu, China). Mix the protein solution with buffer in a 4:1 ratio and then denature in a water bath for 15 min. Subsequently, the samples were electrophoretically separated on polyacrylamide gel (PAGE) and then transferred to polyvinylidene fluoride (PVDF) membrane. After sealing the PVDF membrane with milk, add primary antibody and then incubate overnight at 4 °C in a refrigerator. Next, add the corresponding secondary antibody and continue incubating for 2 h. Finally, ECL A and B solutions were mixed at a ratio of 1:1, and the strips were exposed in the gel imaging system. The antibody information is as follows: Bcl-2 antibody, Bax antibody, Caspase-3 antibody, goat anti-rabbit IgG, primary antibody dilution ratio of 1:1000, and secondary antibody dilution ratio of 1:10,000, Jiangsu Qinke Biological Research Center Co., Ltd., Jiangsu, China.
Colony formation experiment
In this study, gallbladder cancer cells (NOZ) from different groups were seeded in 6-well culture plates (500 cells per well) and then cultured under suitable conditions for 2–3 weeks. During this period, the culture medium should be replaced in a timely manner according to the growth status of the cells. When clear cell clusters are visible under the microscope, remove the culture medium and carefully wash twice with phosphate buffered saline (PBS). Next, fix the cells with a 4% paraformaldehyde solution for 15 min and then wash twice with PBS and dry. Finally, stain the cells with crystal violet staining solution for about 15 min, followed by rinsing with clean water for future use.
Transwell migration and invasion
To ensure the accuracy and reliability of the experiment, cells in good condition were selected for backup. First, the cells were digested using trypsin and then a serum-free cell suspension was prepared. Subsequently, the cells were accurately quantified and inoculated into the upper chamber of Transwell inserts in 6-well plates (the upper chamber was divided into two parts, one with and one without matrix glue). Medium containing 10% FBS was added to the lower chamber, and the entire assembly was placed into an incubator for 24 h. Thereafter, the cells were washed twice with PBS solution, followed by fixation with 4% paraformaldehyde for approximately 20 min. Finally, after about 15 min of staining using the crystal violet solution, photo recordings were performed under the microscope.
Wound healing experiment
Take the six-well plate and mark it with a marker. Mark and locate it at the bottom of the six-well plate. Take the gallbladder cancer cells (in good condition) to prepare the cell suspension. Inoculate the cells into the six-well plate. After the cells are confluent in the six-well plates, use a 200-µl pipette tip to scratch the cells vertically. Gently wash the cells twice with PBS, add serum-free medium, and take photos under the microscope for storage at 0 and 36 h.
Subcutaneous tumorigenesis experiment
Three groups of gallbladder cancer cells (NOZ-OE, NOZ-NC, NOZ) with a cell density of 5 × 10⁷/ml were prepared. The three groups of cells were injected subcutaneously into the right armpit of nude mice (5 rats in each group). Measure and record according to the calculation formula of volume (mm3) = 0.5 × length × width2 (once every 5 days). On the 30th day, all mice were euthanized, and the subcutaneous tumor tissues of each nude mouse were taken out for further analysis.
Immunohistochemistry
1. Paraffin sections were dewaxed and hydrated (sections were obtained from patients with gallbladder cancer and subcutaneous tumors in mice). 2. Section antigen retrieval (using 0.01-mol/l sodium citrate buffer (Beyotime; Jiangsu, China)). 3. 5% goat serum (Beyotime; Jiangsu, China) was used for blocking for 30 min, followed by the addition of primary antibody (incubated overnight at 4 °C). 4. Wash off the primary antibody and incubate with the secondary antibody (at room temperature for 50 min). 5. Wash off the secondary antibody, develop the color with DAB chromogenic solution (Beyotime; Jiangsu, China), control the color development time under the microscope, and the positive color is brown–yellow. 6. Rinse again and re-stain the nucleus with hematoxylin. 7. The slides were dehydrated and sealed with a mounting medium, and the results were read under the microscope. Average Optical Density (AOD) values in the paraffin section positive areas of each gallbladder cancer patient were analyzed using ImageJ.
Hematoxylin and eosin staining
1. Dewax and hydrate with gradient ethanol (paraffin section of subcutaneous tumor in nude mice). 2. Suck dry water, rinse with running water after hematoxylin staining for 5 min, and rinse with running water after 0.6% ammonia water is returned to blue. 3. Drip 0.5% eosin staining for about 3 min and then dehydrate with gradient ethanol. 4. Take photos with microscope 24 h after sealing with neutral gum.
Statistical analysis of data
All the experimental data were from three groups of independent experiments, and GraphPad Prism was used for statistical analysis (T Test, ANOVA). If the results are considered statistically significant, the p value must be less than 0.05.


Comments (0)