
Remember me


To study the maturation of SC-islets upon engraftment, we differentiated SC-islets from the H1 human embryonic stem-cell line (ESM Fig. 1a) [2, 13]. Differentiations used for the study had, on average, 38% insulin-positive/glucagon-negative cells and 36% glucagon-positive/insulin-negative cells, as assessed by flow cytometry at week 3–4 of the final stage of the differentiation (ESM Fig. 1b, c). At this time, the SC-islets were implanted into the kidney capsule of immunocompromised mice [2, 17].
By 3 months post-implantation, the blood glucose levels of mice implanted with SC-islets reached the human fasting euglycaemic level of below 5.6 mmol/l (reduced from 8 mmol/l) (Fig. 1a) [18]. The lowering of mouse blood glucose levels coincided with increasing levels of circulating human C-peptide (Fig. 1b), confirming the functionality of SC-islet grafts and their connection to the recipient’s vasculature. Graft function was directly assessed by IPGTTs at 1 and 4 months after implantation (Fig. 1c, d). We found that grafts functioned better after 4 months (M4 grafts), as seen by faster glucose clearance, with a significantly lower AUC than after 1 month (M1 grafts) (Fig. 1c). This could be attributed to the higher increase in the levels of human C-peptide secreted during the IPGTT in the M4 grafts (threefold) compared with the M1 grafts (1.2-fold) (Fig. 1d). Total C-peptide secreted during the test was also significantly lower for M1 than for M4 grafts (Fig. 1d). Taken together, our data indicated clear functional maturation of the SC-islet grafts between 1 and 4 months.
Fig. 1
Implanted SC-islets humanise mouse blood glucose after 2 months. (a) Blood glucose levels of mice before and after implantation in random-fed mice. Grey box shows ±2 SD of non-transplanted mouse blood glucose levels (before implantation n=17, month 1 n=15, month 2 n=10, month 3 n=13, month 4 n=9). (b) Human C-peptide measured in mouse plasma after implantation in random-fed mice (month 1 n=15, month 2 n=10, month 3 n=12, month 4 n=7). (c, d) Blood glucose (c) and human C-peptide (d) levels during an IPGTT at 1 month (n=8) and 4 months (n=6) after implantation. The test was done on fasted mice. (e) Schematic depicting the experimental setup of the study, created in BioRender. Vähäkangas, E. (2025) https://BioRender.com/09fqjg6. Data are shown as mean ± SEM. *p≤0.05 (unpaired t test with Welch’s correction for AUC)
Cell composition changes do not explain increased functionality post-engraftmentWe next sought to understand how metabolism and/or other aspects of SC-islet biology contribute to the noted functional maturation in vivo and in comparison with non-transplanted primary human islets (Fig. 1e). To assess the possible contribution made by changes in cell composition, we investigated the percentage of insulin-positive beta cells as well as glucagon-positive alpha cells from the overall endocrine cell pool positive for chromogranin A (CHGA) from paraffin sections (Fig. 2a). Beta cell percentage increased slightly by M4, reaching the range of 40–60%, as previously reported for human islets [19, 20] (Fig. 2b). Alpha cell proportions were very similar in human islets and SC-islets pre-engraftment (Fig. 2c). The proportion of alpha cells transiently increased at M1 (Fig. 2c). This could be due to the slightly higher proliferation seen in alpha cells compared with beta cells in SC-islets in M1 grafts (Fig. 2d, e). The proliferation marker Ki67 decreased sharply from its already low levels, both in beta cells and alpha cells between 1 month and 4 months post-implantation (Fig. 2d, e). In M4 grafts, only 0.12% of beta cells and 0.07% of alpha cells showed markers of proliferation. Almost no proliferating alpha or beta cells were detected in the human islet samples (Fig. 2e).
Fig. 2
Minor shifts in the composition of endocrine cells seen in implanted SC-islets. (a) Representative images of sections immunostained for insulin (green), glucagon (magenta) and CHGA (only shown in single channel image); scale bar, 100 μm. (b, c) Quantification of insulin- (b) and glucagon-positive (c) cells as a percentage of the total CHGA+ endocrine cell compartment. SC-islet: n=4; M1 graft: n=5; M4 graft: n=5; human islets: n=3. (d) Representative images of Ki67 stainings (grey) with insulin (green) and glucagon (magenta); scale bar, 100 μm. (e) Quantification of the percentage of insulin-positive and glucagon-positive cells with Ki67. SC-islet: n=3; M1 graft: n=5; M4 graft: n=4; human islets: n=2. (f) Representative TEM images showing insulin granules of different crystallisation status: crystallised (blue arrow); condensed (red arrow); and diffuse (green arrow). Scale bar, 500 nm. (g–i) Percentages of crystallised (g), condensed (h) and diffuse (i) insulin granules shown as a percentage of all granules, average per biological replicate in SC-islets (n=3), M1 graft (n=6), M4 grafts (n=4) and human islet samples (n=3). Data are shown as mean ± SEM. *p≤0.05, **p≤0.01, ***p≤0.001 (one-way ANOVA with Tukey’s multiple comparisons test for all comparisons, except comparison of Ki67% in insulin-positive vs glucagon-positive cells done by paired t test for each timepoint separately). GCG, glucagon; INS, insulin
To verify that no gross compositional changes occurred in other endocrine cell populations, we also investigated the percentages of somatostatin-positive delta cells, solute carrier family 18 member A1 (SLC18A1)-positive enterochromaffin-like cells, pancreatic polypeptide-positive gamma cells and ghrelin-positive epsilon cells (ESM Fig. 2a–h). We did not observe any changes in any of the populations following engraftment. SC-islet delta cell percentages stayed stable at around 2% of the population, lower than the human islet counterpart (ESM Fig. 2a, b). The proportion of enterochromaffin-like cells remained stable, at approximately 4% after implantation (ESM Fig. 2c, d). Enterochromaffin-like cells are not naturally occurring islet cells but rather a byproduct of the differentiation, seen in many previous studies of SC-islets and thus are not present in human islets [7]. Gamma cell proportions were below 0.5% in all SC-islet samples, lower than the approximately 1% seen in human islets (ESM Fig. 2e, f). Epsilon cell proportions on the other hand were equally low in all samples, including the human islets (ESM Fig. 2g, h).
Insulin granule morphology matures by 1 month post-engraftmentAs only minimal shifts in endocrine cell composition occurred upon engraftment, we next investigated cell intrinsic factors that could be an additional contributor to increased graft functionality. We first assessed insulin granule morphology using TEM to determine whether visible granule maturation occurred upon SC-islet engraftment (Fig. 2f–i). We categorised insulin granules as ‘crystallised’ with clear irregularly shaped dense content, ‘condensed’ with a circular ‘fried egg’ morphology and ‘diffuse’ granules without any distinct condensation (Fig. 2f). Previous studies have shown that in human fetal pancreas, diffuse and condensed granules are present already at week 8–10.5, whereas crystallised insulin granule morphology only appears at week 14 [21, 22]. We found that the percentage of crystallised insulin granules increased by M1 (Fig. 2g). M1-graft beta cells had almost 50% crystallised granules, matching the level of granule maturity seen in M4 grafts and human islets (Fig. 2g). In contrast, crystallised morphology was found in only 14% of pre-engrafted SC-islets, leaving them with a higher proportion of condensed and diffuse insulin granules (Fig. 2g–i). As granule maturation occurred before the large shifts in C-peptide levels and acquisition of dynamic graft functionality (Fig. 1b), it is unlikely to be a key determinant of functional maturity.
Mitochondrial content increases upon engraftmentNext, to investigate other possible cell intrinsic maturation mechanisms, we first looked at the protein levels of the beta cell maturation marker MafA, which we have previously reported to be upregulated after engraftment (Fig. 3a) [2]. The proportion of beta cells with high nuclear levels of MafA in SC-islets was very minimal, with an increasing trend following engraftment (Fig. 3b). Human islets had significantly more beta cells with high levels of MafA compared with both SC-islets and M1 grafts (Fig. 3b).
Fig. 3
Mitochondrial content increases upon engraftment. (a) Representative images of sections stained for MafA (grey) and insulin (green); scale bar, 100 μm. (b) Quantification of nuclei with high MafA levels normalised to total nuclei in insulin-positive cells. SC-islet: n=4; M1 graft: n=3; M4 graft: n=4; human islets: n=3; mean ± SEM, one-way ANOVA with Tukey’s multiple comparisons test. (c) TEM images depicting representative mitochondria from SC-islets, M1 grafts, M4 grafts and human islet samples; scale bar, 500 nm. (d) Number of mitochondria per square micrometre quantified from TEM images for cells from SC-islets (pink, 28 cells from 3 biological replicates), M1 grafts (light blue, 55 cells from 6 biological replicates), M4 grafts (blue, 33 cells from 4 biological replicates) and human islets (black, 40 cells from 3 biological replicates); mean with SEM. (e) Percentage of cells in each insulin granule crystallisation category. (f–j) Mitochondrial morphology quantifications from TEM images. Cells from SC-islet (pink, 28 cells from 3 biological replicates), M1 graft (light blue, 55 cells from 6 biological replicates), M4 graft (blue, 33 cells from 4 biological replicates) and human islet (black, 40 cells from 3 biological replicates) categorised into immature (>67% diffuse granules), semi-mature (33–67% diffuse granules) and mature (<33% diffuse granules) insulin granule crystallisation status. Mitochondrial morphology was assessed for area (f), major axis (g), minor axis (h), aspect ratio (minor/major axis ratio) (i) and cristae density (cristae per square micrometre) (j). Median shown in red. *p≤0.05, **p≤0.01, ***p≤0.001 (one-way ANOVA with Tukey’s multiple comparisons test). INS, insulin
MafA is therefore a good marker of intrinsic beta cell maturation, although it is currently unknown how MafA levels and function directly tie to metabolic maturity. Thus, we next conducted detailed studies of mitochondria, as we have previously reported that mitochondrial oxidative phosphorylation (OXPHOS) genes are upregulated following SC-islet engraftment [2]. We found that mitochondrial content increased gradually in beta cells upon engraftment, as seen by increased mitochondrial number per square micron (0.38 mitochondria/µm2 in vitro vs 0.67 at M4, p=0.0004), quantified from TEM images, matching the levels of mitochondria seen in human islets (Fig. 3c, d). This mitochondrial increase was corroborated by the increased immunostaining intensity of TOMM20 (a mitochondrial marker protein) in beta (insulin-positive) vs non-beta cell types (ESM Fig. 3a, b). Pre-implantation SC-islet beta cells contained 26% more mitochondria than non-beta cells within the same sample. After implantation, this difference increased gradually, reaching 57% in M4 grafts.
However, the increase in mitochondrial content was not accompanied by clear morphological changes in mitochondria (ESM Fig. 3c–g). Human islets had smaller mitochondria than SC-islets (ESM Fig. 3c). Even the cristae density of the mitochondria stayed similar from one timepoint to the next (ESM Fig. 3g), a parameter often indicative of increased OXPHOS [23], and previously used as a proxy of SC-islet beta maturation [5]. We noted significant heterogeneity between beta cells from the same sample both in their mitochondrial morphology and in their insulin granule maturity.
To address the noted heterogeneity, we devised a way to estimate the degree of beta cell maturity based on their insulin granule crystallisation status, enabling us to compare the mitochondrial morphology between beta cells of differing maturity. Beta cells were categorised into three maturity states based on diffuse granule percentages: mature; semi-mature; and immature. SC-islet beta cells were mainly categorised into the two less-mature states, whereas human islet beta cells primarily fell into the most mature category (Fig. 3e). M1 and M4 graft samples fell between these two. Beta cells with a more-mature insulin granule status had an overall smaller mitochondrial size and area (Fig. 3f–h). The aspect ratio (major axis/minor axis length) of the mitochondria did not dramatically change between the beta cell categories (Fig. 3i). Even with the maturity categorisation there was no significant difference in cristae density (Fig. 3j). Thus, we conclude that mitochondrial morphological parameters correlate poorly with beta cell maturation.
Utilisation of glucose into TCA-cycle intermediates increases upon engraftmentTo address whether the higher mitochondrial content was connected to increased mitochondrial metabolism, we studied the usage of 13C-labelled glucose in basal (3 mmol/l, low glucose) and stimulatory (17 mmol/l, high glucose) glucose concentrations to determine shifts in glucose sensitivity and usage (Fig. 4 and ESM Fig. 4) [9, 13, 24]. Metabolite tracing was conducted in a similar way for SC-islet, pieces of explanted grafts and non-transplanted human islets. The most significant changes were seen in TCA-cycle intermediates in high glucose: citrate increased from 12% in vitro to 28.7% by M4 (p<0.0001); fumarate increased from 8% in vitro to 17.2% by M4 (p=0.04); α-ketoglutarate (αKG) increased from 13.7% in vitro to 27.2% by M4 (p=0.0083); malate increased from 8.6% in vitro to 22.9% by M4 (p=0.0002); and aspartate increased from 7.3% in vitro to 20.8% by M4 (p<0.0001). All of these showed increased percentages of labelled carbon incorporation following extended engraftment (Fig. 4b–f). The observed increases occurred gradually, achieving human-islet-like glucose incorporation levels at the 4 month timepoint. Glucose utilisation became more concentration-dependent after engraftment, as seen by the relative increase in glucose incorporation under stimulatory glucose concentrations compared with basal levels (Fig. 4b–f).
Fig. 4
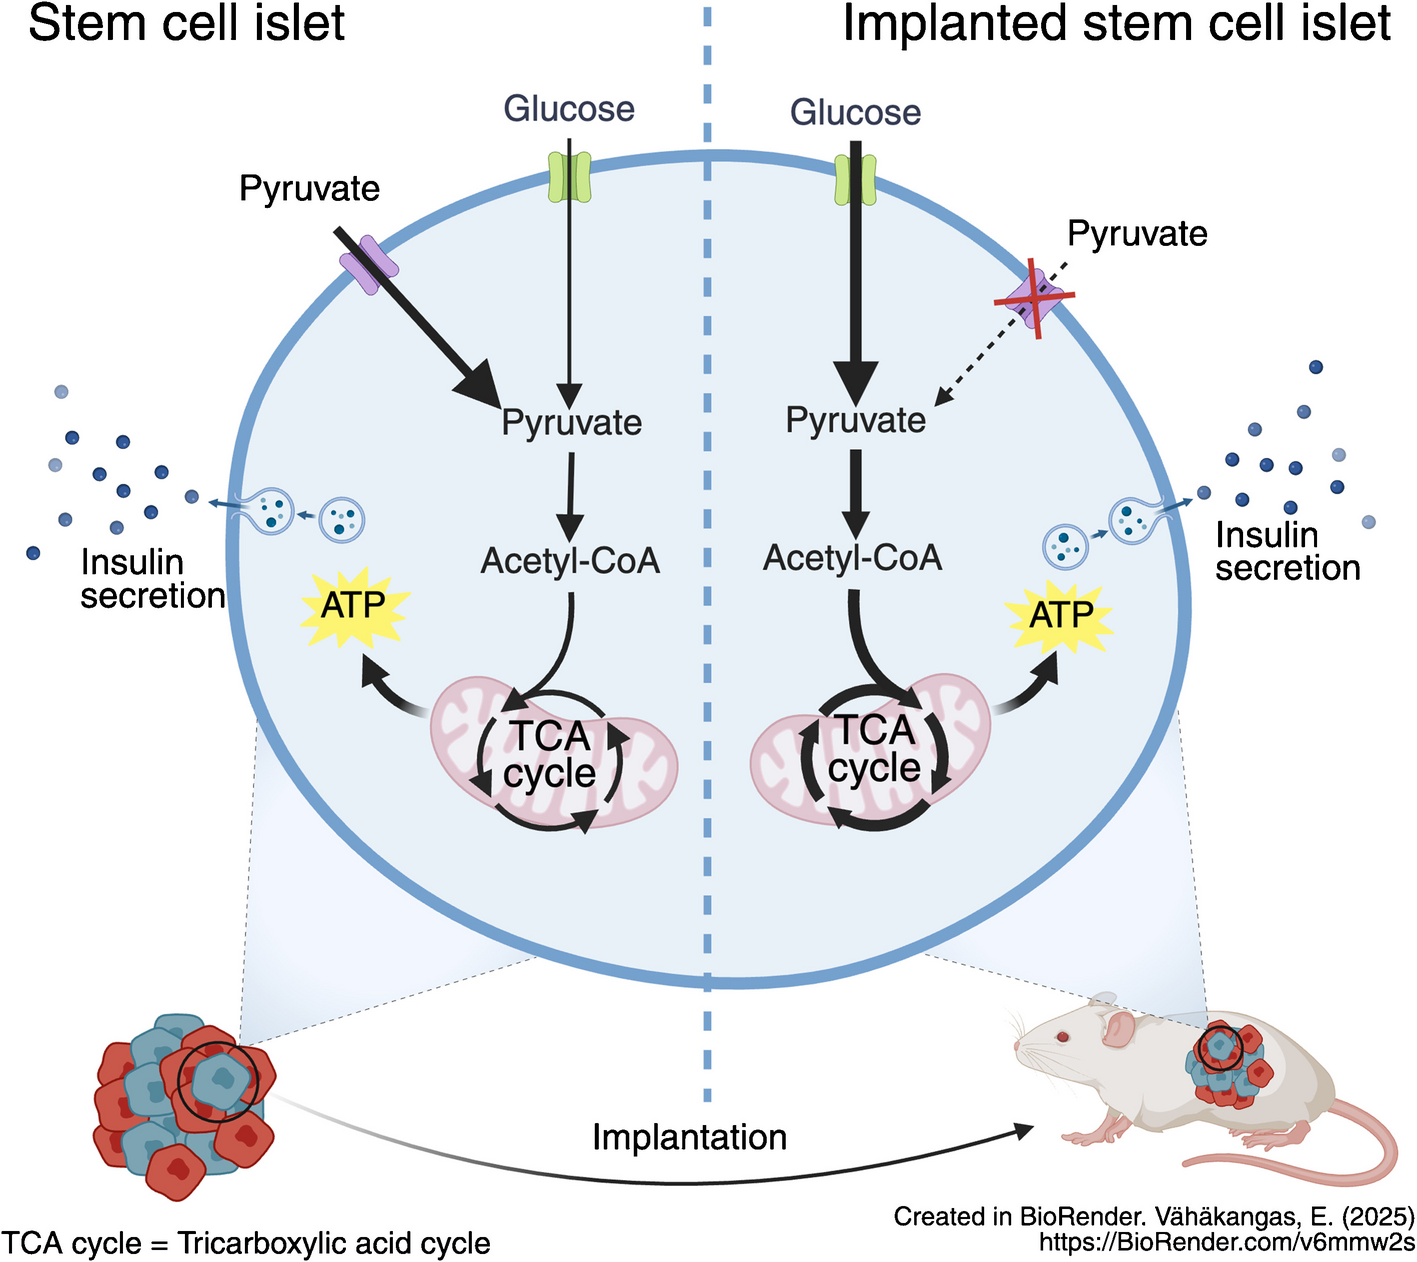
Increased glucose metabolism within mitochondria after engraftment. (a) Schematic depicting glucose processing through glycolysis to TCA cycle. Created in BioRender. Vähäkangas, E. (2025) https://BioRender.com/fpywnr2. (b–f) Percentage of labelled carbons from the total pool of the metabolite, measured in low (3 mmol/l) and high (17 mmol/l) glucose fully labelled with 13C, in SC-islets (n=11), M1 grafts (n=7), M4 grafts (n=5) and human islets (n=7). Results are depicted for citrate (b), αKG (c), fumarate (d), malate (e) and aspartate (f). Data are shown as mean ± SEM. *p≤0.05, **p≤0.01, ***p≤0.001 for comparison between sample types; †p≤0.05, ††p≤0.01, †††p≤0.001 for low glucose vs high glucose (one-way ANOVA with Tukey’s multiple comparisons test). HG, high glucose; LG, low glucose
In addition to core TCA-cycle metabolites, we also detected significant changes in glucose-derived labelling in TCA-derived metabolites (ESM Fig. 4a–d). Such metabolites have been reported as potentially important coupling factors for glucose-induced insulin release [25]. Taken together, carbon usage into the TCA cycle increased post-engraftment, and we therefore next investigated whether this correlated with decreased insulin secretion in response to pyruvate, a fuel with a highly restricted uptake in human islets.
Pyruvate reactivity decreases upon engraftmentTo test glucose- and pyruvate-responsive insulin secretion, we ran dynamic insulin secretion assays in SC-islets and isolated M1 and M4 grafts as well as in donor human islets. All samples showed clear insulin secretion in reaction to KCl-induced cell membrane depolarisation at the end of the test, confirming that they contained viable beta cells throughout the duration of the test (Fig. 5a–d). Although SC-islets responded to glucose, their response to pyruvate was twice as high (Fig. 5a). In M1 grafts, glucose responsiveness was increased, now matching the pyruvate response (Fig. 5b). In M4 grafts, the glucose response was twice as high as the pyruvate response (Fig. 5c), approaching the pattern seen in human islets (Fig. 5d). Exendin-4, a glucagon-like peptide-1 receptor agonist known to potentiate insulin secretion, was effective in all samples in combination with either fuel (Fig. 5a–d). Overall, the relative response of insulin secretion to pyruvate vs glucose decreased sharply upon SC-islet implantation and approached the level seen in human islets (pyruvate-to-glucose reactivity ratio decreased from 2.1 in SC-islets to 0.5 in M4 grafts [p=0.013] [Fig. 5e]). Therefore, we conclude that over the course of engraftment, the relative sensitivity to pyruvate was heavily reduced.
Fig. 5
Pyruvate responsiveness lowers after engraftment. (a–d) Dynamic insulin secretion test run in vitro/ex vivo for SC-islets (a, n=5), M1 grafts (b, n=4), M4 grafts (c, n=5) and human islets (d, n=3) with either high glucose (17 mmol/l, blue) or high pyruvate (10 mmol/l, red) given at the time indicated as high fuel. Insulin release is shown as fold change from basal secretion. Low glucose =3 mmol/l glucose. Data are shown as mean ± SEM. *p≤0.05, **p≤0.01, ***p≤0.001 (two-way ANOVA with Sidak’s multiple comparison test). (e) Ratio of the insulin secretion peak in reaction to high pyruvate (10 mmol/l) vs high glucose (17 mmol/l) from the dynamic insulin secretion test. Data are shown as mean ± SEM. *p≤0.05 (one-way ANOVA with Tukey’s multiple comparisons test). (f) Percentage of labelled carbons from the total pool of the metabolite in fully labelled 13C[pyruvate] (10 mmol/l) measured in SC-islets (pink, n=5), M1 grafts (light blue, n=4), M4 grafts (blue, n=4) and human islets (black, n=2). Data are shown for citrate, αKG, fumarate and malate as mean ± SEM. **p≤0.01, ***p≤0.001 (one-way ANOVA with Tukey’s multiple comparisons test). (g) Schematic depicting pyruvate import as well as processing in a cell. Created in BioRender. Vähäkangas, E. (2025) https://BioRender.com/6t4c37x. (h) SLC16A1 (encoding MCT1) expression (normalised to all counts); reanalysis of single-cell RNA sequencing data from Balboa et al [2]. (i) Representative images of SC-islet, M1 graft, M4 graft and human islet samples stained for insulin (green), E-cadherin (magenta), MCT1 (grey) and nuclei (blue); scale bar, 100 μm. White box indicates the location of cropped single-channel images shown below; scale bar, 10 μm. (j) Quantification of MCT1 co-localisation in E-cadherin-positive cell membrane area in insulin-positive cells. *p≤0.05 (one-way ANOVA with Tukey’s multiple comparisons test). Ecad, E-cadherin; Ex4, exendin 4; INS, insulin
To investigate whether the decreased sensitivity to exogenous pyruvate was connected to mitochondrial metabolism, we followed the incorporation of 13C-labelled carbons from pyruvate (10 mmol/l) (Fig. 5f). The incorporation of pyruvate-derived carbons to citrate, αKG, fumarate and malate in reaction to pyruvate decreased dramatically by 1 month after engraftment, with similarly low levels seen in M4 grafts and human islets (Fig. 5f).
Pyruvate and lactate are transported into the cell by monocarboxylate transporters [26] (Fig. 5g). Earlier studies have shown that MCT1, encoded by SLC16A1, is a disallowed gene in adult beta cells [27]. Its expression leads to dysregulation of insulin secretion [11, 12]. Reanalysis of a previously published single-cell RNA-seq dataset [2] showed that the expression levels of this gene was higher in SC-islets than in graft or human islet samples (Fig. 5h). Immunostaining for MCT1 revealed a cell-membrane-associated signal in SC-islets (Fig. 5i), quantified as co-localisation of MCT1 with the cell membrane protein E-cadherin, encoded by CDH1 (Fig. 5j). The cell-membrane-associated MCT1 signal was lost after engraftment (Fig. 5i, j). As expected, the MCT1 signal was faint and not distinctly localised to the cell membrane in human islet beta cells (Fig. 5i, j).
Comments (0)