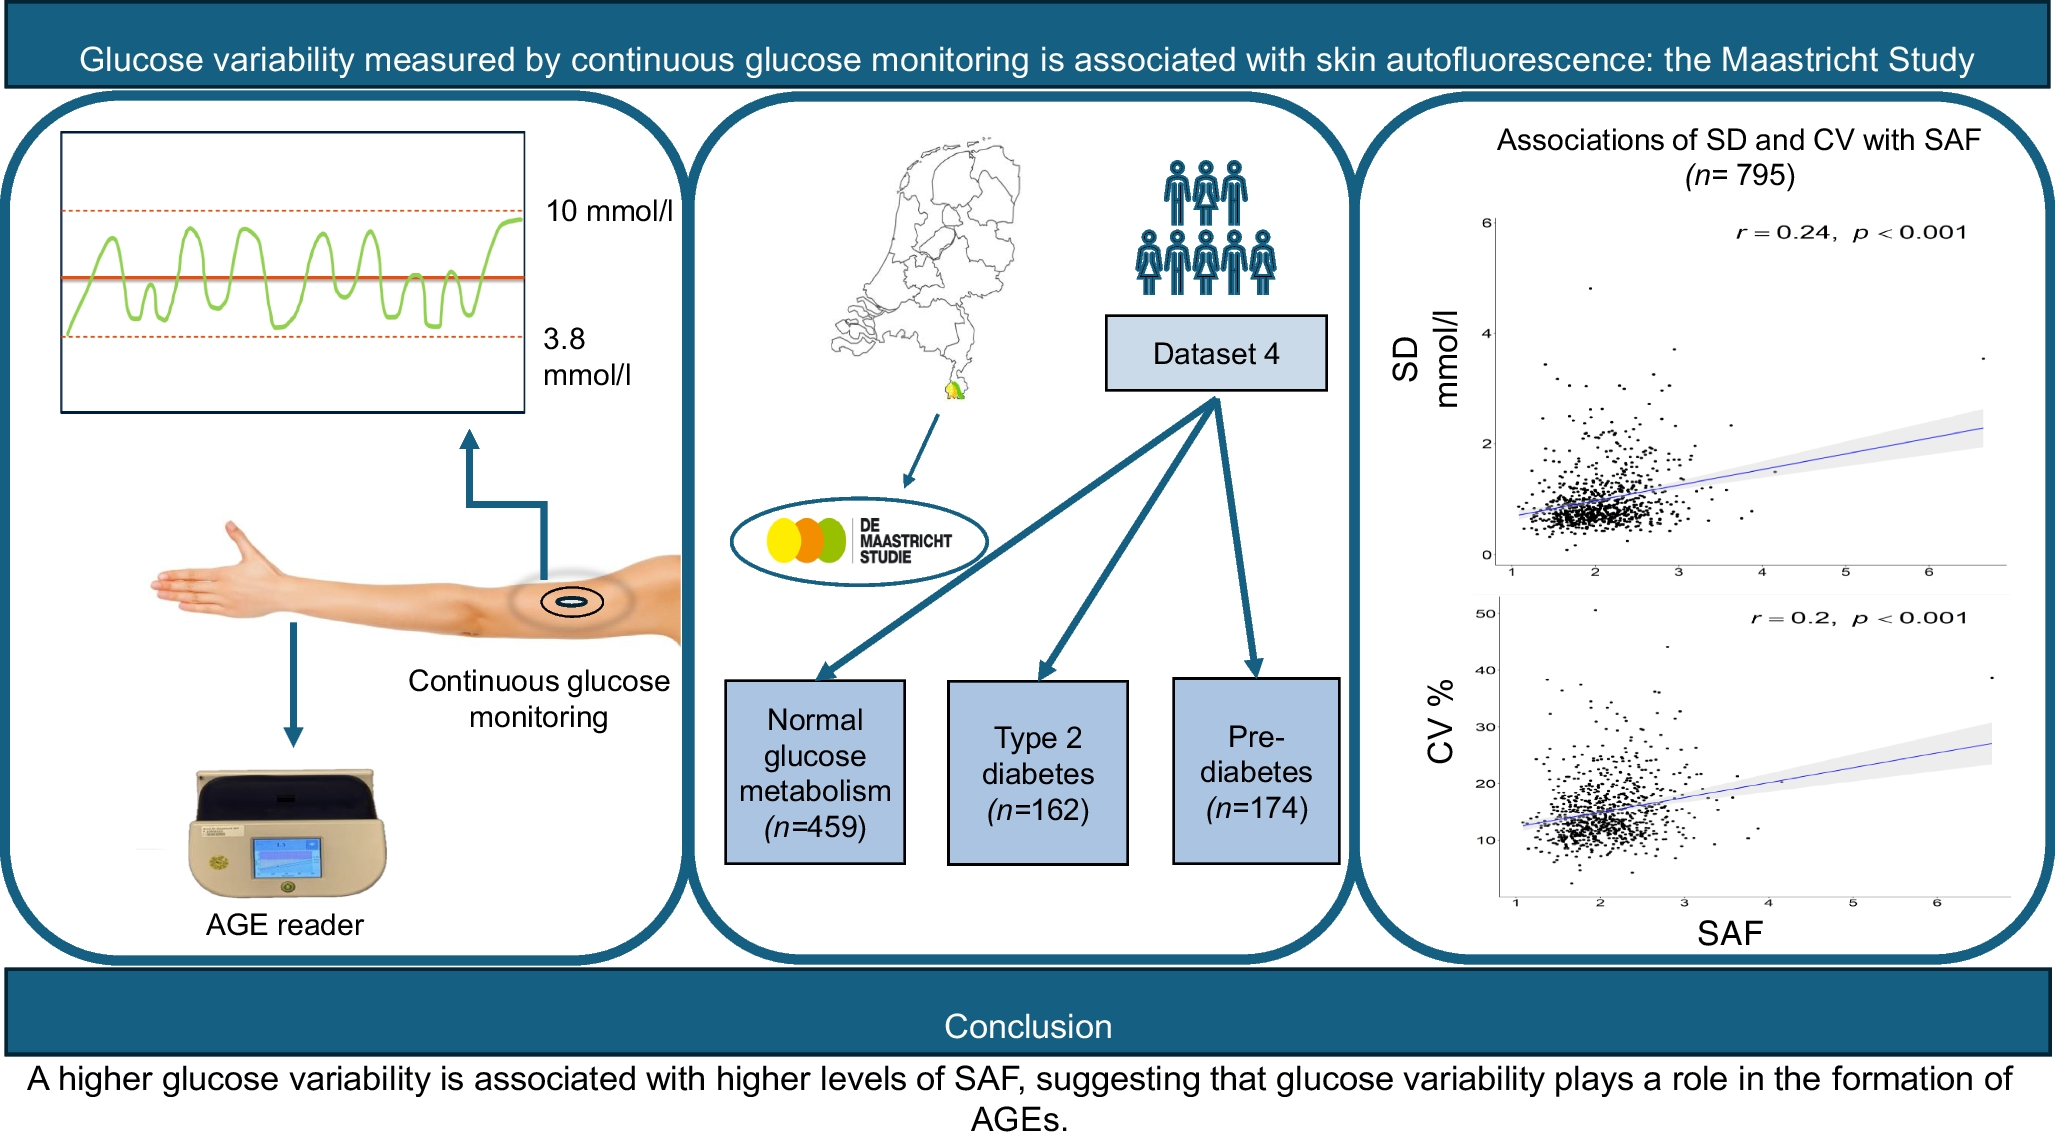
In this study, we found that measurement of AGEs in the skin by SAF was positively associated with glucose variability, as derived from CGM in a large, extensively phenotyped, population. SAF was highest in participants with type 2 diabetes and still higher in people with prediabetes compared with those with normal glucose metabolism. However, the association between measures of glucose variability and SAF was largely independent of the glucose metabolism status and did not materially change after adjusting for a range of confounders. The association between glucose variability and SAF was also not driven by (slightly) elevated glucose values.
We found that both glucose variability and SAF were highest in the participants with type 2 diabetes and lowest in those with normal glucose metabolism, while those with prediabetes had levels of these outcomes that were between these two groups. These results for SAF are in accordance with previous data on SAF in people with type 2 diabetes [28] and those with prediabetes [18, 28,29,30,31]. Although, the size of the association between measures of glucose variability and SAF was small in our study, it should be acknowledged that this was observed in a population with normal to slightly elevated glucose variability, even in those with type 2 diabetes. The relatively short duration of diabetes in the affected population, with a total of 66 people (41%) being diagnosed on the basis of the OGTT performed at study entry, may have played a role here. Additionally, glucose-lowering medication or lifestyle changes used by people with type 2 diabetes to control for glucose fluctuations may have interacted with the associations, since adherence to a healthy diet may reduce SAF [32].
Although the interaction analysis showed that the association between glucose variability and SAF did not differ between the three subgroups, in the stratified analysis we found the association with SD to be apparent in participants with type 2 diabetes and those with normal glucose metabolism, but not in those with prediabetes. These somewhat discrepant findings may be explained by the higher glucose variability in the type 2 diabetes group and the much larger sample size of the normal glucose metabolism group, with the stratified analysis being underpowered to show effects in the prediabetes subgroup. We may speculate upon whether extrapolating our findings to diabetes populations with higher glucose variability may have resulted in SAF measurements that are more clinically relevant but this needs to be confirmed. Adjustments for sex in the model did not materially change the findings, meaning that these findings apply to both sexes without an indication that these differ between men and women.
We found no evidence of effect modification of mild hyperglycaemia, as defined by glucose values above 7.8 mmol/l, between the association of either CV or SD with SAF. We used this relatively low cut-off value rather than TAR (i.e. glucose >10 mmol/l), due to the low number of participants reaching such elevated glucose levels. It has been shown previously that there are associations between SAF and HbA1c in people with type 1 diabetes [33] and in those with type 2 diabetes [34]. Our data extend these findings by showing that varying levels of only mildly elevated glucose levels, in the absence of increased HbA1c as a reflection of chronic hyperglycaemia, is associated with increased levels of SAF.
Glucose variability is of high interest because it is associated with increased cardiovascular complications in people with diabetes [35] and possibly also in those with prediabetes [7]. Our findings regarding the association between glucose variability, as measured by CGM, and SAF, suggest involvement of AGEs as a potential underlying mechanism explaining how glucose variability increases the risk of CVD. However, the range of CV in our study population was well below the currently recommended threshold of CV, set at 36% for people with diabetes [36]. Although this threshold has been reported to distinguish between ‘stable’ and ‘unstable’ blood glucose levels, it should be acknowledged that this distinction is based on its association with hypoglycaemia frequency [37], rather than with the risk of CVD. Previously, we used the same cohort to report an association between glucose variability and aortic stiffness [38], also a determinant of CVD. When these data can be extended to actual CVD events, they would provide arguments to aim for lower CV, at least in people with (type 2) diabetes, than currently recommended.
Both CGM and SAF are measured in the same compartment (i.e. the subcutaneous area), indicating that the formation of AGEs occurs locally rather than originating in the blood compartment. Local formation of AGEs could explain previous observations regarding the presence of AGEs in the endothelium as well as in cardiac tissue, which may play a role in the development of heart failure [39, 40]. However, although SAF is used as a reflection of AGEs in the skin, we cannot exclude the possibility that the association of glucose variability with SAF is due to other fluorophores such as NADH [18].
A strength of this study is the extensive phenotyping of the participants of the Maastricht Study, which allowed us to adjust for multiple confounders. Moreover, we had CGM and SAF data from healthy individuals and individuals with prediabetes and type 2 diabetes, which gave us the opportunity to compare the three groups. There are also limitations. As discussed above, the sample size was relatively small and may have been too small to observe statistically significant associations for the diabetes subgroup. Second, there might be a selection bias towards people with healthier habits and therefore less glucose variability, giving their willingness for participation in the Maastricht Study, which raises questions with respect to generalisability. Indeed, the type 2 diabetes population was well controlled, and their glucose variability was low. Future studies should be repeated in a more diverse type 2 diabetes population with greater glucose variability. Third, CGM data were collected over a period of 1 week, whereas the consensus document recommends gathering data over a minimum of 2 weeks to better reflect longer-term glucose profiles, including glucose variability, at least in people with diabetes [36, 41]. Finally, the cross-sectional nature of our study does not allow for making assumptions about causality.
In conclusion, we found that glucose variability, as measured in interstitial fluid, is positively associated with SAF. This association is independent of sociodemographic factors, CVD risk factors and nutritional factors and of slightly elevated glucose levels and does not differ according to the presence or absence of type 2 diabetes. These data suggest that the formation of AGEs contributes as a mechanism underlying the harmful cardiovascular effects of glucose variability. Future studies are needed to investigate how glucose variability may induce formation of AGEs from a mechanistic point of view and whether this may help to explain how glucose variability increases the risk of harmful cardiovascular effects.


Comments (0)