
Remember me


Since the establishment of kidney transplantation in the 1950s, liver transplantation has gained wide attention among clinicians, and in 1967, the first liver transplant recipient to survive longer than 1 year was reported.1 Living donor liver transplantation (LDLT) is an accepted therapeutic option for patients with end-stage liver disease and hepatocellular carcinoma, with a 1-, 3-, and 5-year survival rate of 86%, 72%, and 68%, respectively. For those who decide on LDLT, the waiting time is considerably shorter compared with those on the waiting list for liver grafts from deceased donors.2 Nevertheless, LDLT still poses challenges to transplant surgeons postoperatively in the intensive care unit (ICU) and during long-term follow-up. Early posttransplantation complications include acute rejection, vascular thrombosis, anastomotic leakage, gastrointestinal hemorrhage, infection, prolonged encephalopathy, and acute kidney injury (AKI),3 among which AKI is of significant concern.
A recent meta-analysis reported the pooled incidence of AKI after liver transplantation as 37.5%.4 AKI after liver transplantation may lead to the deterioration of patient status secondary to a prolonged ICU stay, increased risk of graft failure, progression to chronic kidney disease (CKD), and most importantly, increased mortality rates.5,6 Furthermore, patients who require renal replacement therapy due to AKI often exhibit a higher mortality rate.7
AKI is a multifactorial clinical condition that has undergone extensive study in various clinical settings. Of particular interest to liver transplantation, recipient-related and perioperative risk factors have been identified. Individual risk factors, such as overweight, anemia, hypoalbuminemia, high serum creatinine (SCr), hyponatremia, and high model for end-stage liver disease (MELD) and sequential organ failure assessment scores have been recognized. Preexisting conditions, such as nonalcoholic liver disease, liver cirrhosis, diabetes mellitus (DM), diuretic use (furosemide/spironolactone), and the presence of hepatic encephalopathy in addition to perioperative risk factors, including ABO incompatibility, intraoperative blood loss or hypotension requiring red blood cell (RBC) transfusion, and prolonged cold ischemia time (CIT) or warm ischemia time (WIT), are all considered significant risk factors.4,6,8–10 Early allograft dysfunction (EAD) within 1 week after transplantation has also been identified as associated with postoperative AKI and a higher mortality rate.11,12
The association of serum uric acid (SUA) levels with AKI is controversial.13 High preoperative SUA levels have been associated with the risk of postoperative AKI in patients undergoing cardiac and renal surgeries and in patients with severe burns.14–19 In deceased donor liver transplantation, baseline SUA levels were significantly higher in recipients with newly developed CKD.20 In contrast, several cohorts have shown that low SUA levels might lead to AKI development.16,21 Individuals with initially normal kidney function but low SUA levels were reported to experience a time-dependent decline in estimated glomerular filtration rate (eGFR).22 Matsukuma et al23 demonstrated that low SUA was associated with a deterioration of renal function to end-stage renal disease in patients with IgA nephropathy. Because the significance of preoperative SUA levels on postoperative AKI remains unclear in LDLT, the aim of our study was to assess the relationship and predictive value of preoperative SUA levels with postoperative AKI in LDLT.
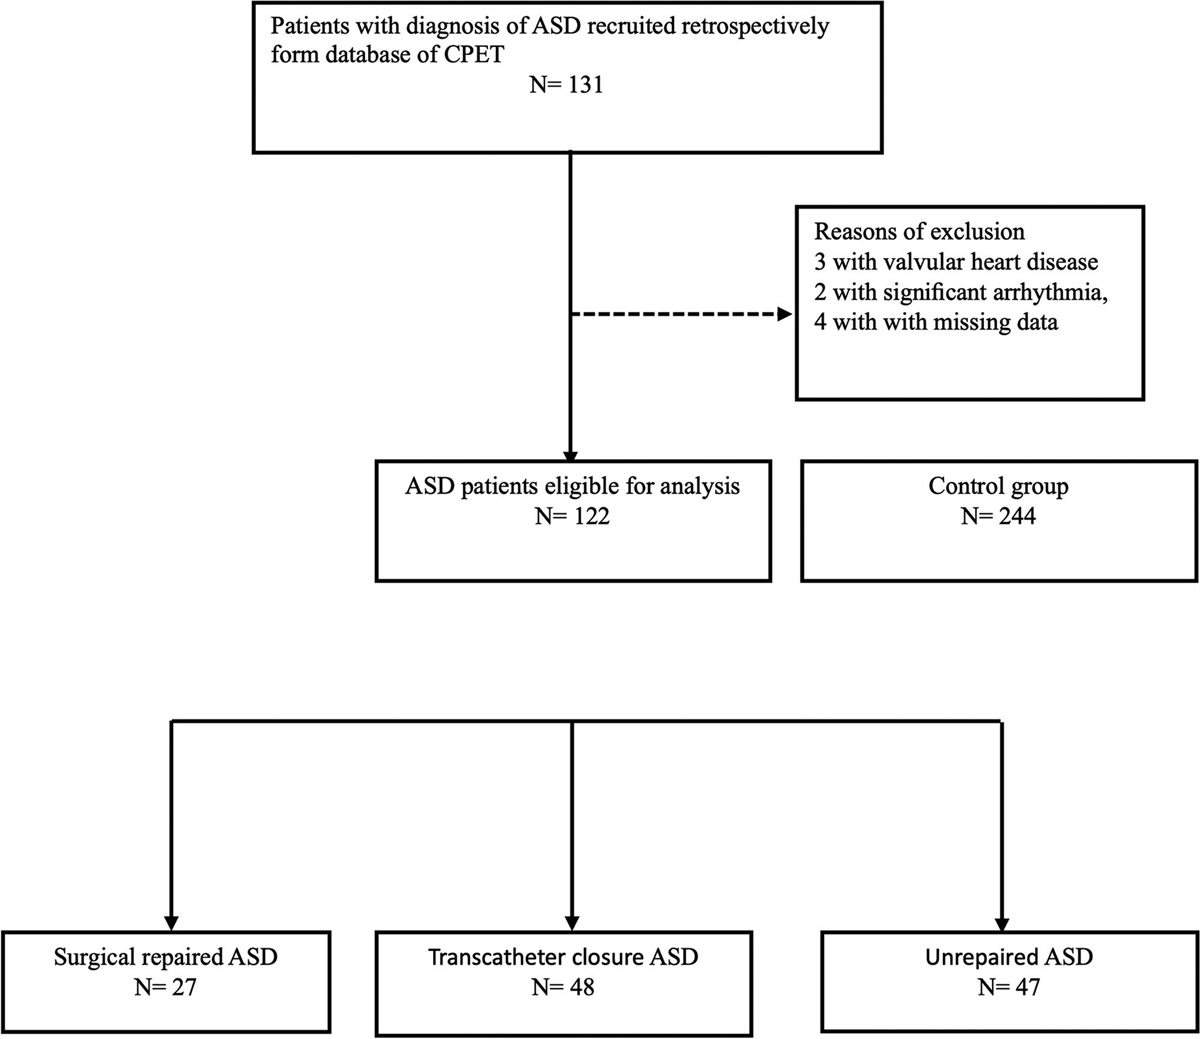
2. METHODS 2.1. ObjectivesThis prospective, observational, single-institution hospital-based study was performed in a tertiary medical center and analyzed 87 consecutively recruited patients who underwent LDLT from October 2018 to July 2022 at Chang Gung Memorial Hospital (Taoyuan, Taiwan). All subjects gave informed consent before study participation. Exclusion criteria were preoperative sepsis, shock status, pulmonary hypertension (defined as pulmonary artery wedge pressure >35 mmHg), and patient refusal. Patients with gout and taking uric acid-lowering medication, such as allopurinol, patients with moderate to severe CKD (defined as eGFR <45 mL/min/1.73 m2 for more than 3 months, according to the KDIGO 2012 guideline), and patients who received renal replacement therapy before transplantation were also excluded (Fig. 1).24,25
 Fig. 1:
 Flow diagram of patient selection. AKI = acute kidney injury; CKD = chronic kidney disease; eGFR = estimated glomerular filtration rate; hr = hours; LDLT = living donor liver transplantation.
This study was approved by the Institutional Review Board of Chang Gung Memorial Hospital (approval no.: IRB2106130012; CMRPG3L1831, CMRPG3L1311-3, CMRPG3L0611-3).
2.2. Data collection and variable definitionAn indwelling arterial catheter was inserted for perioperative monitoring and blood sample collection before inducing general anesthesia. Laboratory test results, including SUA and SCr, were recorded before surgical incision and for 3 consecutive days following transplantation. The SCr was used to calculate the eGFR as follows: eGFR = 186 × Cr−1.154 × age−0.203 × (0.742 if women) mL/min/1.73 m2. The patients’ MELD scores were calculated on the basis of the data on the day of transplantation. The preinduction SCr level was used as the baseline value to analyze postoperative AKI. AKI was defined as an increase in SCr ≥0.3 mg/dL (26.5 μmol/L) within 48 hours or an increase in SCr ≥1.5 times the baseline value within 7 days postoperatively, as per KDIGO.24,25 In our study, early AKI was defined as the development of AKI within 72 hours following LDLT,6 and recipients who developed AKI within 72 hours postoperatively were allocated to the AKI group. All recipients were followed up for the total length of ICU stay, EAD development, and 1-year mortality. Hyponatremia, hypoalbuminemia, and anemia were defined as serum sodium <125 mmol/dL, serum albumin <3.5 g/dL, and hematocrit <36% for women and <41% for men, respectively.
2.3. Statistical analysisThe AKI incidence was initially plotted against the SUA quartiles. The receiver operating curve (ROC) was plotted to determine the cutoff value of SUA for AKI. According to the value, the patients were categorized into either the high or low SUA group, which was then utilized for further analysis as a categorical variable. Reported recipient-related risk factors for postoperative AKI after liver transplantation were analyzed between the AKI and the non-AKI groups using independent t test for numerical variables and Chi-squared test for categorical variables. Multivariate logistic regression without elimination was then performed to examine low SUA as a potential risk factor. Adjustments were made for known risk factors for AKI, namely age, gender, body mass index (BMI), diuretic use, ABO incompatibility, DM, hypertension, viral hepatitis, alcoholism, MELD score, creatinine, blood urea nitrogen (BUN), anemia, hypoalbuminemia, hyponatremia, blood loss, RBC transfusion, CIT, and WIT. A p value <0.05 was considered statistically significant. All statistical analyses were performed using SPSS v24 (IBM Corp. Released 2019, IBM SPSS Statistics for Windows, Version 26.0; IBM Corp, Armonk, NY).
3. RESULTSFrom October 2018 to July 2022, 87 patients underwent LDLT (Fig. 1). We excluded 17 patients secondary to their history of gout, moderate CKD, or requirement for renal replacement therapy before transplantation. The mean patient age was 54.9 ± 10.3 years, with 53 (75.7%) males and 17 (24.3%) females. There were 48 (68.6%) patients with hepatitis B virus- and hepatitis C virus-related cirrhosis (viral cirrhosis), and 22 (31.4%) had alcoholic liver cirrhosis. Early AKI (within 72 hours postoperatively) was observed in 26 (37.1%) patients and no AKI in the remainder (44, 62.9%). The average MELD score was 15.9 ± 8. There were 57 (81.4%) anemic, 50 (71.4%) hypoalbuminemic, and 16 (22.9%) hyponatremic patients. The average SCr, BUN, and SUA levels were 0.74 ± 0.32, 15.37 ± 7.22, and 4.7 ± 2.1 mg/dL, respectively (Table 1).
Table 1 - Baseline characteristics of the enrolled patients Characteristics Mean ± SD Preoperative lab data Mean ± SD N (%) N (%) Gender Creatinine, mg/dL 0.74 ± 0.32 Male 53 (75.7%) eGFR, mL/min/1.73 m2 114.5 ± 45.9 Female 17 (24.3%) BUN, mg/dL 15.37 ± 7.22 Age, y 54.9 ± 10.3 Hematocrit, % 43.3 ± 9.8 Height, cm 165.2 ± 7.4 Anemia 57 (81.4%) Body weight, kg 68.5 ± 12.7 Albumin, g/dL 3.2 ± 0.7 BMI 25 ± 4 Hypoalbuminemia 50 (71.4%) ABO incompatibility 7 (10%) Serum sodium, mmol/L 135.5 ± 15.56 Diuretic use 36 (51.4%) Hyponatremia 16 (22.9%) Comorbidity Uric acid, mg/dL 4.7 ± 2.1 DM 15 (21.4%) Low SUA (<4.15 mg/dL) 25 (35.7%) Hypertension 22 (31.4%) Perioperative factors Viral hepatitis 48 (68.6%) Cold ischemia time, min 38.6 ± 24.5 HBV 38 (54.3%) Warm ischemia time, min 32.3 ± 7.2 HCV 11 (15.7%) Intraoperative blood loss, mL 1943 ± 2139 HCC 32 (45.7%) RBC transfusion, unit 7.5 ± 7.7 Alcoholism 22 (31.4%) MELD score 15.9 ± 8BMI = body mass index; BUN = blood urea nitrogen; cm = centimeter; dL = deciliter; DM = diabetes mellitus; eGFR = estimated glomerular filtration rate; g = gram; HBV = hepatitis B virus; HCC = hepatocellular carcinoma; HCV = hepatitis C virus; kg = kilogram; L = liter; LVEF = left ventricular ejection fraction; m = meter; MELD = model for end-stage liver disease; mg = milligram; min = minute; mL = milliliter; RBC = red blood cell; SUA = serum uric acid.
There were no statistically significant differences observed between patient gender, BMI, preoperative left ventricular ejection fraction, and comorbidity distribution between the AKI and the non-AKI groups, except that DM was more prevalent in the AKI group than the non-AKI group (34.6% vs 13.6%, p = 0.039; Table 2). Additionally, preoperative laboratory test results were similar between the two groups, with the exception of hypoalbuminemia, which was more prevalent in the AKI than the non-AKI group (88.5% vs 61.4%, p = 0.015). The SUA level was also significantly lower in the AKI group than in the non-AKI group (3.7 ± 1.5 vs 5.3 ± 2.2 mg/dL, p = 0.001). No statistical difference was observed in both CIT and WIT during transplantation. Although intraoperative blood loss did not significantly differ between the two groups, the AKI group received more RBC transfusions than the non-AKI group (10.4 ± 9.6 vs 5.7 ± 5.9 units, p = 0.014). No statistical significance was observed in intraoperative urine output between the two groups (1.17 ± 1.15 vs 1.35 ± 0.76 mL/kg/h, p = 0.416). Supplementary Table 1, https://links.lww.com/JCMA/A254, shows the nutritional status (BMI and albumin). A statistically significant difference among the SUA quartile groups was observed for albumin (p = 0.038) but not BMI.
Table 2 - A comparison of basic characteristics and biochemical data for AKI and non-AKI patients AKI non-AKI p Mean ± SD Mean ± SD N (%) N (%) Gender Male 22 (84.6%) 31 (70.1%) 0.182 Female 4 (15.4%) 13 (29.5%) Age, y 58 ± 9 53 ± 10.7 0.050 Height, cm 164.9 ± 7.3 165.4 ± 7.6 0.762 Body weight, kg 67.8 ± 11.7 68.9 ± 13.4 0.718 BMI 24.9 ± 3.7 25.1 ± 4.2 0.821 ABO incompatibility 2 (7.7%) 5 (11.4%) 0.621 Diuretic use 15 (57.7%) 21 (47.7%) 0.420 Comorbidity DM 9 (34.6%) 6 (13.6%) 0.039a Hypertension 9 (34.6%) 13 (29.5%) 0.659 Viral hepatitis 21 (80.8%) 27 (61.4%) 0.910 HBV 18 (64.3%) 20 (45.5%) 0.054 HCV 4 (15.4%) 7 (16.9%) 0.954 HCC 5 (19.2%) 17 (38.6%) 0.349 Alcoholism 10 (38.5%) 22 (50%) 0.091 MELD score 18.3 ± 9.2 14.5 ± 7 0.055 Preoperative lab data Creatinine, mg/dL 0.74 ± 0.3 0.75 ± 0.33 0.806 eGFR, mL/min/1.73 m2 117.2 ± 61.1 113 ± 34.8 0.713 BUN, mg/dL 14.67 ± 6.02 15.79 ± 7.88 0.535 Anemia 24 (92.3%) 33 (75.0) 0.072 Hypoalbuminemia 23 (88.5%) 27 (61.4%) 0.015a Hyponatremia 8 (30.8%) 8 (18.2%) 0.226 SUA, mg/dL 3.7 ± 1.5 5.3 ± 2.2 0.001a Low SUA (<4.15 mg/dL) 16 (61.5%) 9 (20.5%) 0.001a Perioperative factors Cold ischemia time, min 38 ± 21.6 39 ± 26.2 0.874 Warm ischemia time, min 33 ± 7.3 32 ± 7.2 0.575 Blood loss, mL 2419 ± 2453 1662 ± 1903 0.154 RBC transfusion, unit 10.4 ± 9.6 5.7 ± 5.9 0.014a Intraoperative UO, mL/kg/h 1.17 ± 1.15 1.35 ± 0.76 0.416AKI = acute kidney injury; BMI = body mass index; BUN = blood urea nitrogen; cm = centimeter; dL = deciliter; DM = diabetes mellitus; eGFR = estimated glomerular filtration rate; g = gram; HBV = hepatitis B virus; HCC = hepatocellular carcinoma; HCV = hepatitis C virus; kg = kilogram; L = liter; LVEF = left ventricular ejection fraction; m = meter; MELD = model for end-stage liver disease; mg = milligram; min = minute; mL = milliliter; RBC = red blood cell; SUA = serum uric acid; UO = urine output.
ap value < 0.05.
To determine the association of SUA with the risk of early AKI, the patients were divided into four groups by SUA quartiles (Fig. 2). A low SUA level appeared to be associated with a high risk of early posttransplantation AKI. By convention, hypouricemia is accepted as uric acid >7.0 mg/dL and >6.5 mg/dL for men and women, respectively. However, in our study, such a traditional definition of hyperuricemia failed to demonstrate the actual relationship between SUA level and early AKI. Thus, we used ROC analysis, and our results revealed that the area under the curve was 0.73 (Fig. 3), with an SUA value of 4.15 mg/dL identified as the optimal cutoff point (sensitivity, 79.2%; specificity, 59.4%). The patients were then classified into the high SUA or low SUA group. The low SUA group comprised 35.7% of transplant recipients (Table 1), and the prevalence of low SUA was higher in the AKI compared with the non-AKI group (61.5% vs 20.5%, p = 0.001; Table 2). Further analysis by univariate logistic regression demonstrated that preoperative DM, low SUA, hypoalbuminemia, and more intraoperative blood loss were significantly related to AKI, with an odds ratio (OR) of 3.35, 6.22, 4.83, and 1.09, respectively (Table 3). After taking into consideration other risk factors described in the literature, multivariate logistic regression analysis was performed, which again showed that a low SUA level (<4.15 mg/dL) was a significant risk factor for AKI (OR, 9.37, confidence interval, 2.05-43.06, p = 0.004) (Table 3).
Table 3 - Logistic regression analysis of the risk factors Univariate regression Multivariate regression OR (95% CI) p OR (95% CI) p Male sex 2.31 (0.66-8.02) 0.189 Age, y 1.06 (1.00-1.12) 0.057 Height, cm 0.36 (0.00-254.49) 0.758 Body weight, kg 0.99 (0.96-1.03) 0.714 BMI 0.99 (0.87-1.12) 0.818 Diuretic use 1.49 (0.56-3.97) 0.421 ABO incompatibility 0.65 (0.12-3.62) 0.623 Comorbidity DM 3.35 (1.03-10.92) 0.045a Hypertension 1.26 (0.45-3.56) 0.659 Viral hepatitis 2.64 (0.84-8.34) 0.097 HBV 2.70 (0.97-7.51) 0.057 HCV 0.96 (0.25-3.66) 0.954 HCC 0.63 (0.23-1.68) 0.350 Alcoholism 0.38 (0.12-1.19) 0.097 MELD score 1.06 (1.00-1.13) 0.061 Preoperative lab data Creatinine, mg/dL 0.87 (0.19-4.06) 0.857 eGFR, mL/min/1.73 m2 1.00 (0.99-1.01) 0.709 BUN, mg/dL 0.98 (0.91-1.05) 0.530 Anemia 4.00 (0.81-19.73) 0.089 Hypoalbuminemia 4.83 (1.26-18.57) 0.022a Hyponatremia 2.00 (0.65-6.20) 0.230 SUA, mg/dL 0.63 (0.46-0.86) 0.004a Low SUA (<4.15 mg/dL) 6.22 (2.12-18.28) 0.001a b9.37 (2.05-43.06) 0.004a Perioperative factors Blood loss, mL 1.09 (1.01-1.16) 0.022a RBC transfusion, unit 1.00 (1.00-1.00) 0.158 Cold ischemia time, min 1.02 (0.95-1.09) 0.570 Warm ischemia time, min 1.00 (0.98-1.02) 0.872AKI = acute kidney injury; BMI = body mass index; BUN = blood urea nitrogen; cm = centimeter; dL = deciliter; DM = diabetes mellitus; eGFR = estimated glomerular filtration rate; g = gram; HBV = hepatitis B virus; HCC = hepatocellular carcinoma; HCV = hepatitis C virus; kg = kilogram; L = liter; LVEF = left ventricular ejection fraction; m = meter; MELD = model for end-stage liver disease; mg = milligram; min = minute; mL = milliliter; RBC = red blood cell; SUA = serum uric acid.
ap value < 0.05.
bAdjusted for age, gender, BMI, diuretic use, ABO incompatibility, DM, hypertension, viral hepatitis, alcoholism, MELD score, creatinine, BUN, anemia, hypoalbuminemia, hyponatremia, blood loss, RBC transfusion, cold ischemia time, warm ischemia time.
 Fig. 2:
 Incidence of early AKI vs SUA level quartile. AKI = acute kidney injury; SUA = serum uric acid.
 Fig. 3:
 ROC curve for the cutoff value of SUA. ROC = receiver operating characteristic; SUA = serum uric acid.
3.2. Correlation between AKI and preoperative SUAAKI was classified into three stages according to the extent of increase in SCr, and the patients were stratified according to the AKI stages between the high and low SUA groups (Table 4). In patients without AKI and with less severe AKI (stage 1), a higher proportion had high preoperative SUA levels (>4.15 mg/dL), whereas more patients with a higher AKI stage (stages 2 and 3) were in the low SUA group.
Table 4 - Staging of AKI in high and low SUA groups Low SUAAKI = acute kidney injury; SUA = serum uric acid.
There were no deaths within the first month after LDLT in the non-AKI group but two patients died in the AKI group due to liver graft dysfunction in addition to early AKI. That said, there was no significant difference between the survival rates at 1, 3, 6, and 12 months for the AKI and the non-AKI groups (Fig. 4 and Table 5). Similarly, no significant differences in EAD and the length of ICU stay were observed between the two groups.
Table 5 - Analysis for survival, EAD and ICU stay
Comments (0)