
Remember me


Gallstone disease is a common public health problem. The prevalence of cholecystectomies due to gallstone disease is high. Risk factors contributing to the formation of gallstones include defective gallbladder motility, metabolism, and secretion of cholesterol and bile acids.1–3 Cholesterol stones (CS) and pigment stones (PS) are the two types of gallstones. CS consists mostly of cholesterol crystal.4 Hypersecretion of biliary cholesterol and impaired coordination of gallbladder motility can lead to crystallization and precipitation of stones.4–6 Metabolic disorders such as obesity, diabetes mellitus, and dyslipidemia are risk factors for CS development4 and are known to be associated with gut dysbiosis.7 PS is composed mainly of calcium hydrogen bilirubinate. Anaerobic bacterial infection, hemolysis, ineffective erythropoiesis, and impaired enterohepatic cycling of unconjugated bilirubin are disorders associated with PS formation.3,6
The role of the biliary and gut microbiota in the pathogenesis of gallstones is still indefinite. The gut microbiota participates in the biotransformation of primary and secondary bile acids, which alter the composition of the bile acid pool and modify signaling via the farnesoid X receptor (FXR) and G protein-coupled membrane receptor 5 (TGR5).8,9 The signaling pathways are not only related to bile acid hemostasis but are also responsible for insulin signaling, and glucose and lipid hemostasis.9 The interaction of bile acid and gut microbiota is bidirectional, namely, the composition of gut microbiota can also be modulated by bile acid.8,9 The host metabolism can be influenced through the interaction between gut microbiota and bile acid.
Gallstone is associated with gut dysbiosis.1,10,11 The overgrowth of intestinal bacteria may contribute to the deconjugation of bile salts and bilirubin in the colon. Conditions that potentially lead to bacterial overgrowth, such as constipation, total parenteral nutrition, and high carbohydrate diet, may influence the enterohepatic cycling of unconjugated bilirubin.3 The decrease or absent of bacterial degradation of unconjugated bilirubin and dysfunction of gut barrier could result in the cholelithiasis of pigment stone.3 Also, the unconjugated bilirubin participates in the regulatory T-cell differentiation, which can lead to pigment stone formation.3 An increased abundance of the phyla Proteobacteria and a decrease in the genera Faecalibacterium, Lachnospira, and Roseburia were found in both bile and fecal samples of patients with gallstone.1 Others reported that a decrease in Ruminococcus spp. might be a biomarker for cholesterol gallstones.12 Bacteria might participate in the formation of gallstone through the modulation of bile acid metabolism, and the secretion and absorption of cholesterol.13 The genera Eubacterium, a cholesterol-lowering bacterium, was decreased in gallstone patients.11 Yet, enrichment of Desulfovibrionales might promote gallstone formation by altering the hydrophobicity of bile acid and modifying the activity of 7α-dehydroxylation.13
Gut microbiota might also affect the motility of the gallbladder by regulating gut hormones. In an animal study, germ-free mice presented a significant decrease in their intestinal cholecystokinin (CCK) level and impaired gallbladder emptying to exogenous CCK.14 Microbiota is a key participant in the communication between the enteric nervous system, central nervous system, and gut hormones.15,16 The microbiota-gut-brain axis is essential for the hemostasis of intestinal metabolism. The enteroendocrine cells and secretion of gut peptides could be up-regulated as the luminal environment of intestine changes.17 The microbial metabolites, such as bile acids, short-chain fatty acids (SCFAs), and trimethylamine-N-oxide (TMAO), contribute to regulation as well.15 The alteration of microbiota and gut hormones is responsible for the motility of the gastrointestinal and biliary tract,16 and hypomotility of gallbladder can lead to gallstone formation.1,2
Our aim in this study was to assess the differences between gut microbiota, gut metabolomic, and metabolic parameters in gallstone patients and controls, and attempted to identify representative biomarkers. This study would focus on the comparison between healthy subjects and gallstone patients before they underwent surgery.
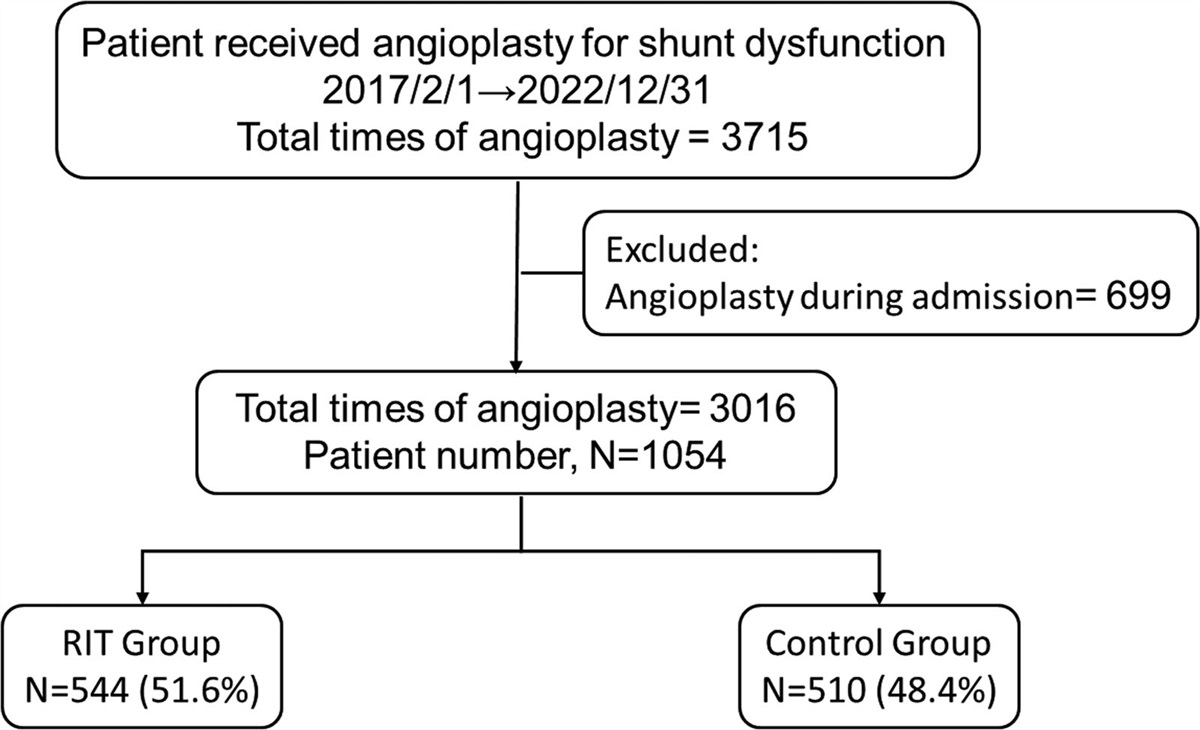
2. METHODS 2.1. Patients and controlsPatients who were diagnosed with gallstone disease and who received laparoscopic cholecystectomies from March 2019 to February 2021 were enrolled as the study group. The exclusion criteria were as follows: (1) uncured underlying malignancy; (2) any gastrointestinal tract surgery in the past; (3) aged less than 20 years; (4) severe underlying diseases, such as cirrhosis, chronic renal failure, or uremia; and (5) recent acute coronary syndrome or stroke, severe heart failure, or respiratory failure. Individuals who met the criteria of metabolic syndrome were excluded.18 In addition, subjects who had received antibiotics, proton pump inhibitors, histamine-2 receptor antagonists (H2RAs), nonsteroidal anti-inflammatory agents (NSAIDs), or probiotics within 1 month of sample collection were excluded. We enrolled 20 subjects with gallstone disease. Among them, 15 had PS and five had CS. We also recruited 30 subjects in the control group (C), who received abdominal ultrasound and had been confirmed to have no gallstones. This study complied with the standards of the Declaration of Helsinki and current ethical guidelines. The study was approved by the hospital’s Institutional Review Board (IRB) (No. 2017-06-008B).
2.2. Anthropometric and laboratory measurementAfter the participants signed informed consents, detailed clinical records, including smoking and alcohol consumption, and past medical and family history were obtained using a standardized questionnaire. Anthropometric measurements (i.e., body height, body weight, waist circumference, body mass index [BMI], blood pressure, and heart rate) were taken by experienced nursing staff before cholecystectomy. Blood tests including glucose, total cholesterol, high density cholesterol (HDL), and triglyceride were administered before cholecystectomy.
Fresh stool samples for gut microbiota and gut metabolomic in the gallstone patients were collected before cholecystectomy, as well as in the control group. Fecal samples were collected from study subjects at home and were immediately frozen. Frozen samples were delivered to the hospital within 4 hours in insulating polystyrene foam containers.
2.3. Human fecal bacterial genomic DNA extractionGenomic DNA were extracted from the fecal samples using the commercially available QIAamp Fast DNA Mini Kit (Qiagen, Crawley, UK) following the manufacturer’s instructions for DNA extraction. Fecal samples were homogenized. The suspension was heated for 5 minutes at 95°C and vortexed for 15 seconds to lyse the cell completely. Then the suspension was centrifuged to pellet the stool particles. After removal of contamination, the samples were mixed with 400 μL buffer AL and 400 μL ethanol (96–100%) sequentially. The filtrate was discarded after centrifugation. After extraction of the DNA, the amounts and quality of isolated genomic DNA were determined with NanoDrop ND-1000 (Thermo Scientific, Wilmington, DE, USA). Genomic DNA was stored at –80°C before 16S rRNA sequencing.
2.4. 16S rRNA sequencingThe primer set for the reaction was chosen as 341F_V3_illumina (5′-CCTACGGGNGGCWGCAG-3′) and 805R_V4_illumina (5′-GACTACHVGGGTATCTAATCC-3′).19 PCR consisted of an initial denaturation at 94°C for 2 minutes, 30 cycles of 92°C for 20 seconds, 55°C for 30 seconds, and 68°C for 1 minutes for amplification, and 68°C for 1 minutes to finish replication on all templates, and stored at 4°C. Dual-indexes (barcodes) were used for each sample before sequencing and next-generation sequencing was performed by the Illumina MiSeq Desktop Sequencer following the standard protocol.19,20
2.5. Targeted metabolomic for SCFAs and bile acidsQuantification of fecal SCFAs and bile acids was determined in gallstone patients and the control by ultra-high performance liquid chromatography-mass spectrometry (UHPLC-MS/MS).21 The samples were extracted from the collected stool. After suspension in double distilled water, homogenization, and centrifugation, the supernatant was taken for analysis.
The concentrations of SCFAs and bile acids were compared between gallstone patients and the controls using the Wilcoxon rank-sum test. Linear regression was performed to evaluate the relationship between microbial metabolites, clinical metabolic parameters, and the alpha diversity indices.
2.6. Data processing and statistical analysisThe raw reads were assembled using FLASH v.1.2.11.22 The quality of reads was evaluated by the QIIME 1.9.1 pipeline, and low-quality reads (Q < 20) were truncated.23 Operational taxonomic units (OTUs) were clustered at a 97% sequence identity using the UPARSE function in USEARCH (v7.0.1090).24 Sequence annotation was performed via the RDP classifier (v.2.2) algorithm based on the information of the Silva Database v.132, with a confidence threshold of 80%.25–27
Differential abundance analyses were performed to identify the representative taxa in each group, such as metagenomeSeq analysis,28 linear discriminant analysis effect size (LEfSe) analysis,29 and analysis of composition of microbiomes (ANCOM).30 These methods were distinctive in the rarefication, normalization, and data transformation in the processing, and led to different results.31,32 The metagenomeSeq analysis was performed using the metagenomeSeq R package. Cumulative sum-scaling normalization (CSS) and zero-inflated Gaussian distribution were applied to preserve the effects of lower-quartile abundance of features.28P values were corrected by the BH false discovery rate method. LEfSe was based on the relative abundance of taxa. Rarefied features were used in the analysis, followed by total sum-scaling normalization. Nonparametric factorial Kruskal-Wallis sum-rank test was applied to identify possible differentially abundant features.29 An linear discriminant analysis score (log 10) >4 was considered significant in the study. ANCOM required compositional log-rations. A BH false discovery rate significance threshold of 0.05 was used for calculation of W statistics. W statistics higher than 80% were considered significant in this study.30 Principal component analysis (PCA) with a covariance matrix was performed to evaluate the intergroup differences after dimension reduction and to identify the key taxa driving the discrimination. Logistic regression and receiver operating characteristic analysis were performed to evaluate the discrimination ability of certain taxa between individuals with or without gallstones.
The α-diversity indices evaluating gut microbial community richness (the observed OTUs and Chao1 indices) and community diversity (the Shannon index and Pielou’s evenness) were calculated using the QIIME pipeline.33 Analysis of similarities (ANOSIM) and permutational multivariate analysis of variance (PERMANOVA) were used to determine whether the community structures significantly varied among and within groups. Both nonmetric multidimensional scaling (NMDS) and principal co-ordinates analysis (PCoA) were implemented based on Bray-Curtis dissimilarity.34
All data were expressed as means ± standard deviation. For parameters that were not normally distributed, nonparametric analysis was applied. The results were compared between groups depending on the type of data analyzed using either Student’s t or the Wilcoxon rank-sum test. All p values were two-tailed, and a p value <0.05 was considered statistically significant.
3. RESULTSWe enrolled 30 healthy controls and 20 patients with gallstones in this study. Twelve of the gallstone patients had episodes of biliary tract infection, including acute cholecystitis and acute cholangitis before the surgery. Eight of the gallstone patients decided to undergo cholecystectomy because of recurrent biliary colic. Among them, 15 had PS and five had cholesterol stone. A total of 4,515,370 raw pair-end reads was identified from the stool samples. After assembling and filtering, 3,667,948 effective tags were recognized. A total of 777 OTUs was clustered at 97% sequence identity. The baseline characteristics are listed in Table 1.
Table 1 - The baseline characteristics of the patients with CS, PS, and the controls Control (n = 30) CS (n = 5) PS (n = 15) p Sex (F/M) 15/15 3/2 8/7 Age 51.5 ± 7.04 55.6 ± 16.8 63.4 ± 14.7 0.01 BMI (kg/m2) 23.7 ± 3.1 26.6 ± 5.7 25.1 ± 3.6 0.15 TG 114.0 ± 78.3 121.0 ± 84.3 138.6 ± 53.1 0.57 Chol 203.7 ± 46.1 150.0 ± 58.8 159.0 ± 31.6 <0.01All continuous variables were presented as mean ± SD.
BMI = body mass index, Chol = total cholesterol, CS = cholesterol stone, PS = pigmented stone, TG = triglyceride.
The relative abundance of taxa in each group was compared. At the family level, Bacteroidaceae was abundant in all groups. The control group had more abundant Ruminococcaceae, Prevotellaceae, and Veillonellaceae compared to the gallstone groups. Instead, Lachnospiraceae, Enterobacteriaceae, and Fusobacteriaceae seemed to be more abundant in the PS and CS groups at the family level (Fig. 1A). At the genus level, the PS group had relatively abundant Escherichia-Shigella as compared to the other two groups. The control group had more abundant Faecalibacterium, Prevotella 9, and Prevotella 2 than the gallstone groups (Fig. 1B).
 Fig. 1:
 Relative abundances of bacteria across the three study groups. The relative abundances at the family level (A) and genus level (B). At the family level, the control group had a higher percentage of Ruminococcaceae, Prevotellaceae, and Veillonellaceae than the gallstone groups, while Lachnospiraceae, Enterobacteriaceae, and Fusobacteriaceae were more abundant in patients with gallstones. At the genus level, the control group had more abundant Faecalibacterium, Prevotella 9, and Prevotella 2 than gallstone patients, while the gallstone patients had higher Escherichia_Shigella. C = control, CS = cholesterol stones, PS = pigment stones.
3.1. Differential abundance analysisSeveral differential abundance analyses, including metagenomeSeq analysis, LEfSe, and ANCOM, were performed to identify the representative taxa in each group. In the metagenomeSeq analysis, the control group was significantly abundant in the family Ruminococcaceae as compared to the other groups (p < 0.01 in both), while Enterobacteriaceae (CS vs. control: p = 0.04; PS vs. control: p = 0.04), Fusobacteriaceae (CS vs. control: p < 0.01; PS vs. control: p = 0.02), and Bifidobacteriaceae (CS vs. control: p = 0.03; PS vs. control: p < 0.01) were more abundant in the PS and CS groups. Also, Desulfovibrionaceae was more prominent in the CS group compared with the control group (p = 0.04; Supplementary Fig. 1A, https://links.lww.com/JCMA/A247). At the species level, the control group had significantly higher Bacteroides plebeius DSM 17135 than the other groups (p < 0.01 both). The CS group had more abundant Bacteroides uniformis than the control group (p < 0.01). Yet, the PS group was more abundant in Bacteroides fragilis (p < 0.01) and Bifidobacterium longum subsp. Longum (p < 0.01) than in the control (Supplementary Fig. 1C, https://links.lww.com/JCMA/A247). On the other hand, the ANCOM showed that the abundance of the family Moraxellaceae was significantly different between the gallstone group and the control group. However, Moraxellaceae presented in all groups. A similar scenario occurred in the Ruminococcus gnavus group, Clostridium innocuum group, and Erysipelatoclostridium. All of them showed a significant difference between the control and gallstone groups but with small absolute abundance. On the other hand, the PS group had significantly higher Escherichia-Shigella than the control group in the metagenomeSeq analysis (p = 0.03), while the significance was missing in ANCOM (Supplementary Figs. 1B, 1D, 1E, https://links.lww.com/JCMA/A247).
In the LEfSe, Bacteroidaceae, Enterobacteriaceae, and Fusobacteriaceae were the dominant families in the PS group, whereas the family Ruminococcaceae was scant in the PS and CS groups. At the genus level, Acidaminococcus and Bacteroides were dominant in the PS group, and Fusobacterium was abundant in the CS group. The abundance of Faecalibacterium, Prevotella 9, and Prevotella 2 was scarce in both the PS and CS groups (Table 2, Fig. 2; Supplementary Fig. 2, https://links.lww.com/JCMA/A247). Desulfovibrionaceae and Escherichia-Shigella did not show a statistical significance in the LEfSe analysis.
Table 2 - The predominant bacteria in the three groups at different level under LEfSe LEfSe (LDA > 4.0) Control CS PS Phylum FusobacteriaCS = cholesterol stone, LDA = linear discriminant analysis, LEfSe = linear discriminant analysis effect size, PS = pigmented stone.
 Fig. 2:
 Known taxa abundance reported by LEfSe in the bacterial community. Taxa with an LDA score of >4 and p < 0.05 in the Wilcoxon signed-rank test are shown. The comparison between all groups is presented with relative abundance in the heatmap. C = control, CS = cholesterol stones, PS = pigment stones.
PCA with a covariance matrix was performed to reduce the dimension and identify key taxa. In the analysis, we found that genera Prevotella 9, Bacteroides plebeius DSM 17135, genera Faecalibacterium, genera Escherichia-Shigella, and Bacteroides uniformis were key taxa driving the discernment between the groups.
To further evaluate whether the abundance of certain bacteria can distinguish between individuals with gallstones and those without gallstones, logistic regression, and receiver operating characteristic curve were performed on genera Prevotella 9, Bacteroides plebeius DSM 17135, genera Faecalibacterium, genera Escherichia-Shigella, and Bacteroides uniformis. Genera Faecalibacterium and Bacteroides plebeius DSM 17135 presented the best area under curve (AUC) (0.86 and 0.85, respectively), followed by genera Escherichia-Shigella (AUC = 0.70) and Bacteroides uniformis (AUC = 0.68). On the other hand, genera Prevotella 9 presented an AUC less than 0.5 despite its well performance under LEfSe analysis and PCA (Supplementary Fig. 3, https://links.lww.com/JCMA/A247). When comparing the CS group to controls separately, Bacteroides uniformis and Bacteroides plebeius DSM 17135 presented the best AUC (0.94 and 0.83, respectively), following by genera Faecalibacterium (AUC = 0.79) and genera Escherichia-Shigella (AUC = 0.69). For the PS group, genera Faecalibacterium had the best performance (AUC = 0.88), following by Bacteroides plebeius DSM 17135 (AUC = 0.85), genera Escherichia-Shigella (AUC = 0.70), genera Prevotella 9 (AUC = 0.65), and then Bacteroides uniformis (AUC = 0.60).
3.2. Alpha and beta diversityThe richness and evenness of gut microbiota were similar among the three groups (Fig. 3A-D). In addition, a history of biliary tract infection, antibiotic use, and age had no impact on the microbial diversity in this cohort.
 Fig. 3:
 The alpha diversity of fecal microbiota among patients with CS, patients with PS, and healthy controls. The richness of bacteria among the three groups in observed OTU and Chao 1 index. Evenness of bacteria among the three groups in Pielou’s evenness and Shannon index. All showed no significant differences between the groups using the t test. The boxes (containing 50% of all values) show the median (horizontal line across the middle of the box) and the interquartile range, whereas the black spots represent the 10th and 90th percentiles. C = control, CS = cholesterol stones, PS = pigment stones.
Both the analysis of similarities (ANOSIM) and the permutational multivariate analysis of variance (PERMANOVA) were used to determine the intergroup differences. ANOSIM showed significant differences in microbial composition between the control and CS groups (R = 0.46, p < 0.01) and between the control and PS groups (R = 0.53, p < 0.01). A comparison based on Bray-Curtis dissimilarity was displayed graphically by nonmetric multidimensional scaling (NMDS) (Fig. 4A). A similar result was found in PERMANOVA (control vs. CS: F = 2.72, R2 = 0.076, p < 0.01; control vs. PS: F = 5.39, R2 = 0.111, p < 0.01). The intergroup difference between the CS and PS groups was insignificant in both ANOSIM and PERMANOVA. A comparison based on Bray-Curtis dissimilarity was presented with principal co-ordinates analysis (PCoA) (Fig. 4B).
 Fig. 4:
 Comparison of bacterial composition among the three groups. ANOSIM showed that intergroup difference was significant between the control and CS groups (R = 0.46, p < 0.01) and between the control and PS groups (R = 0.53, p < 0.01). The comparison was shown in NMDS based on Bray-Curtis dissimilarity (A). A similar result was found in PERMANOVA (Control vs. CS: F = 2.72, R2 = 0.076, p < 0.01; Control vs. PS: F = 5.39, R2 = 0.111, p < 0.01). The intergroup difference between the CS and PS groups was insignificant in both analyses. The comparison is displayed with PCoA based on Bray-Curtis dissimilarity (B). The axes represent the dimensions explaining the greatest proportion of variance in the communities. Each symbol represents a sample. C = control, CS = cholesterol stones, NMDS = nonmetric multidimensional scaling, PCoA = principal co-ordinates analysis, PS = pigment stones.
3.3. Microbial metabolite analysisIn this cohort, only 18 individuals had qualified stool samples for untargeted metabolomic analysis. Among them, nine were gallstone patients and nine were healthy controls.
A total of 11 SCFAs and 38 bile acids was detected in the analysis. Among the SCFAs, only n-butyric acid showed a significantly higher level in the control group than in the gallstone group (p < 0.01). The level of n-butyric acid was not correlated with BMI, serum triglyceride, serum cholesterol level, or alpha diversity indices. No statistical differences were found in the pairwise comparison between control and gallstone patients for bile acids. Only 3α-hydroxy-12 ketolithocholic acid (12-keto LCA), one of the secondary bile acids, presented a higher level in the controls (p = 0.07). The level of 12-keto LCA had a positive correlation with the total cholesterol level (p = 0.04) and alpha diversity indices (observed OTU, p < 0.01; Shannon index, p = 0.05). The concentration of deoxycholic acid (DCA) was relatively higher among the controls (p = 0.33). Linear regression model showed that deoxycholic acid was positively correlated to microbial richness (p = 0.04). The level of cholic acid (CA) was relatively higher in the gallstone group (p = 0.15) and was negatively correlated with microbial richness (p < 0.01) and had a trend of a negative association with the serum cholesterol level (p = 0.11) (Fig. 5).
 Fig. 5:
 Measurements of SCFAs and bile acids. The fecal concentration of SCFAs and bile acids was evaluated by untargeted metabolomics. N-butyric acid showed a significantly higher level in controls than in the gallstone group (p < 0.01). No statistical differences were found in the pairwise comparison between controls and gallstone patients for bile acids. 12-keto LCA (p = 0.073) and DCA (p = 0.33) presented a relatively higher level in the control group, while CA was relatively higher in the gallstone group (p = 0.15). 12-keto LCA = 3α-hydroxy-12 ketolithocholic acid, CA = cholic acid, DCA = deoxycholic acid, SCFAs = short-chain fatty acids.
4. DISCUSSIONIn the present study, we compared the microbial diversity and composition between healthy individuals and patients with gallstones. All fecal samples were collected before cholecystectomy; thus, the results were not impacted by an altered microenvironment after surgery. Furthermore, we sought to identify the representative taxa in healthy individuals and gallstone patients. The fecal concentration of metabolites was also analyzed, and only n-butyric acid revealed a significantly higher level in healthy individuals. Additionally, the levels of 12-keto LCA, deoxycholic acid, and cholic acid were correlated with the serum cholesterol level, bacterial richness, and evenness.
Previous studies reported dysbiosis in patients with gallstones.1,10,11 Frost et al35 revealed that distinct dysbiosis was correlated with the cholecystectomy rather than asymptomatic gallstone. However, the population of this study consisted of individuals who lived in Northeast Germany, and the dietary habits and prevalence of cholesterol and pigment gallstones differed from those of the Asian population.35 Unlike the previous study, all the analyzed fecal samples in our study were collected before cholecystectomy, and most of the patients had pigment gallstones. Our research suggested that the richness and evenness of gut microbiota in the healthy control group was similar to that of gallstone patients who had not undergone cholecystectomy. Yet, there were still significant differences in the composition of the microbiota. Furthermore, whether patients had a history of acute cholecystitis or had received antibiotic treatment did not lead to significant differences in the composition of gut microbiota. This indicated that the primary event causing deviation in the microbiota composition of the subjects was the presence or absence of gallstones, rather than cholecystitis, antibiotic use, or surgery.
Aging and dietary habits are factors that can change the microbial composition of the gut.36 The gallstone patients were older than the healthy controls in the present cohort. However, the microbial composition did not show significant separation in PCoA while using different age boundaries. It indicated that the aging difference may not be significant in this cohort. Our study did not record the dietary habits of the participants. Therefore, the impact of dietary habits on microbial composition could not be assessed.
Similar to previous studies, an increase in the phyla Proteobacteria and a decrease in the genera Faecalibacterium were noted in gallstone patients in this cohort.1 In the differential abundance analysis, the family Bacteroidaceae, Enterobacteriaceae, and Fusobacteriaceae were increased in gallstone patients. Enterobacteriaceae was enriched in patients with acute cholecystitis and was associated with the quantity of endotoxin.37 The genera Enterobacter, Klebsiella, and Escherichia, which belonged to the family Enterobacteriaceae, were reported as being enriched in gallstone patients, with a possible association with cholesterol crystallization.38 Instead, Fusobacterium had a potential inhibitory effect on cholesterol-to-coprostanol conversion, which was reported to be enriched in gallstone patients.11Desulfovibrionaceae, a bacterium that enhances the growth of 7α-dehydroxylating bacteria, is involved in cecal secondary bile acid production, and prompts intestinal cholesterol absorption,13 was also more prominent in the CS group.
Furthermore, Bacteroides fragilis and Bifidobacterium longum subsp. Longum, the Ruminococcus gnavus group, and Clostridium innocuum were notably higher in the PS group. Bacteroides fragilis and Bifidobacterium longum subsp. Longum had bile salt hydrolase (BSH) and 7α/β-hydroxysteroid dehydrogenase (HSDH) activity.11,39,40 BSH is responsible for deconjugation; the deconjugated primary bile acids could be further converted to secondary bile acids through different pathways.11,40,41 Both the Ruminococcus gnavus group and Clostridium innocuum carried 3?/β-HSDH, which results in the epimerization of DCA and lithocholic acid (LCA).39–41 On the other hand, we found a significantly abundant Bacteroides plebeius DSM 17135 in the control group, which possesses gene activities that responsible for bile acid deconjugation and consequent dehydroxylation.42 The control group had relative higher fecal levels of DCA, LCA, and iso-LCA, which may account for the abundant Bacteroides plebeius DSM 17135. However, aside from factors related to gallstones, the control group also exhibited higher serum cholesterol levels. Therefore, further identification is required to determine whether the content of this bacterium is more closely associated with hypercholesterolemia or gallstones. The control group also had abundant Ruminococcaceae, Faecalibacterium, and Prevotella than gallstone patients, which were known as SCFA-producing bacteria.12,43 Moreover, n-butyric acid
Comments (0)