
Remember me


Bone is a weight-bearing and soft tissue-protecting structural tissue that is maintained primarily by the balance between the activities of osteoclasts, which resorb bone, and osteoblasts, which form bone.1 Osteoporosis is a systemic skeletal disease that occurs when bone homeostasis is disrupted, leading to increased osteoclast activity.2 This increased osteoclast activity is manifested by pathologies such as osteopenia, tissue weakness, and destruction of bone microstructure. Osteoporosis affects more than 200 million people worldwide and occurs in all age groups, but is particularly prevalent in women and the elderly.3 The development of osteoporosis is influenced by various factors such as hormonal imbalance, aging, decreased nutritional intake, and drug side effects, among which the incidence of osteoporosis due to menopause is the highest.4
Osteoporosis is typically treated using bone resorption inhibitors, most commonly bisphosphonates. These inhibitors have a high affinity for calcium crystals and inhibit osteolysis in the body, ultimately reducing bone resorption.5 However, long-term bisphosphonate administration can result in side effects such as atypical femoral fractures, abnormal vaginal bleeding, and osteonecrosis of the jaw.5 Natural hormones are increasingly being used to alleviate the symptoms of female hormone deficiency,6 and there is an urgent need to identify natural products with few and/or infrequent side effects that are amenable for long-term administration to replace bone resorption inhibitors.
Mori Radicis Cortex (MRC) is the root bark of the mulberry tree (Morus alba L), and is known as “Sangbaegpi” in Korea.7 MRC can relieve what is described in Korean medicine as heat in the lungs, stop coughing, and alleviate swelling through the release of urine and MRC has also been shown to relieve symptoms of female hormone deficiency, including lowering body temperature, calming, lowering blood pressure, and slowing heart rate.8 Recent studies have shown that MRC has anti-inflammatory effects by inhibiting the overexpression of nitric oxide (NO), which is one of the factors that induce osteoclast formation and exacerbate ovariectomy (OVX) osteoporosis.9 In addition, MRC contains various bioactive components from the phenolic compound and flavonoid families, several of which have been shown to inhibit osteoclast differentiation. In particular, chlorogenic acid and caffeic acid inhibit osteoclast bone resorption by controlling key factors in osteoclast differentiation.10,11 Morusin has also been shown to prevent bone loss in postmenopausal osteoporosis models.12 Based on these potential benefits of MRCs, they have shown promise in attenuating bone loss in postmenopausal osteoporosis models through inhibition of osteoclast activity.
In the present study, we investigated the effect of MRC on osteoporosis through the suppression of osteoclast differentiation. The results showed that MRC suppresses osteoclast differentiation via the nuclear factor of activated T cells, cytoplasmic 1 (NFATc1)/c-Fos pathway and reduces bone mineral density loss induced in vivo in ovariectomized rats. Thus, MRC is a potential therapeutic agent for the treatment of osteoporosis.
2. METHODS 2.1. ReagentsAlendronate (ALN), 17β-estradiol (E2), and tartrate-resistant acid phosphatase (TRAP) kits and 4′,6-diamidino-2-phenylindol (DAPI) were purchased from Sigma-Aldrich (St. Louis, MO). Proteinase K was purchased from Thermo Fisher Scientific (Waltham, MA) and 3,3′-diaminobenzidine (DAB) solution, biotinylated secondary antibody, and the VECTASTAIN® Elite® ABC-HRP Kit was purchased from Vector Laboratories (Newark, CA). Dulbecco’s modified Eagle medium (DMEM) was purchased from Welgene (Daejeon, South Korea). Alpha-minimum essential medium (α-MEM), penicillin/streptomycin (P/S), and Dulbecco’s phosphate-buffered saline (DPBS) were purchased from Gibco (Grand Island, NY). Fetal bovine serum (FBS) was obtained from Atlas Biologicals (Fort Collins, CO). Receptor activator of nuclear factor kappa-Β ligand (RANKL) was purchased from PeproTech (London, UK). Cell counting kit-8 (CCK-8) was purchased from Dojindo Molecular Technologies (Kumamoto, Japan). Acti-stain™ 488 Fluorescent Phalloidin was purchased from Cytoskeleton, Inc. (Denver, CO). Anti-NFATc1 antibody (Cat. No. 556602) used for western blotting was purchased from BD Pharmingen, Inc. (San Diego, CA). Anti-c-Fos (SC-447), anti-β-actin (SC-8432) used for Western blotting, and anti-NFATc1 (SC-7294) used for immunohistochemistry (IHC) were purchased from Santa Cruz Biotechnology (Dallas, TX). Enhanced chemiluminescence (ECL) solution was purchased from Amersham (Buckinghamshire, UK). Nitrocellulose blotting membranes were purchased from GE Healthcare (Chicago, IL). RNAiso Plus was purchased from TaKaRa Bio, Inc. (Otsu, Japan). SuperScript II Reverse Transcriptase was purchased from Invitrogen (Carlsbad, CA). KAPA Taq DNA Polymerase Kit was purchased from Kapa Biosystems (Wilmington, MA).
2.2. Preparation of MRCMRC was purchased from Omni Herb (Seoul, Korea), and the extraction process was conducted at the Department of Anatomy, College of Korean Medicine, Kyung Hee University.
MRC was extracted with two solvents, ethanol and water, and the extraction method was as follows. MRC ethanol extract (MRC); MRC (300 g) was soaked in 3 L of 30% ethanol for 2 weeks. During the cold soaking, the solution extracted using ethanol was filtered twice through gauze and filter paper. MRC water extract (MRCW); MRC (100 g) was added to 1 L of distilled water and boiled for 2 hours. The filtrate was concentrated under reduced pressure at 45 ± 5°C using a model N-1110S decompression concentrator (EYELA, Shanghai, China). The extract was dried in a lyophilizer to obtain a powdered ethanolic extract. After lyophilization, the extract was stored at −20°C until use. The yield rate of MRC is 8.9%, and the yield rate of MRCW is 10.9%. The extract was thawed and dissolved in dimethyl sulfoxide (DMSO) or distilled water immediately before experimental use and filtered through a sterile filter (pore size 0.22 µm). When cells were treated with MRC, the concentration of DMSO in the culture medium did not exceed 1%.
2.3. Animal experiments and induction of osteoporosisFemale 12-week-old Sprague-Dawley (SD) rats purchased from Koatech (Pyoung-taek, Gyeonggi-Do, Korea) were kept in a controlled environment at a temperature of 22 ± 2 °C, 50 ± 10% relative humidity, and a 12h light-dark cycle. The experimental protocol of this animal study was reviewed and approved by the Institutional Animal Care and Use Committee of Kyung Hee University (KHSASP-21-399). All animals were stabilized for 1 week, and OVX was performed to induce postmenopausal osteoporosis. The OVX and MRC treatment groups were anesthetized by deep breathing with 5% isoflurane, and both ovaries were removed while maintaining the concentration at 3-4% isoflurane. The sham operation (sham) group underwent the same surgical procedure, but the ovaries were not resected. To prevent surgical site infections, the rats were intraperitoneally injected with gentamicin (4 mg/kg) for 3 days after surgery. The rat was divided into the following six groups (n = 8 per group): sham (orally administered distilled water without OVX); OVX (orally administered distilled water after OVX); E2 (orally administered 100 µg/kg E2 after OVX); ALN (orally administered 3 mg/kg sodium ALN after OVX); MRC low (MRC_L; orally administered 2.89 mg/kg MRC after OVX); and MRC high (MRC_H; orally administered 20.23 mg/kg MRC after OVX). The dosage of MRC given orally to rats was determined according to the quantity of herbal medicine typically ingested by an average adult (60 kg), which is 8g in traditional Korean medicine. The metabolic rate of rats in the MRC_H group was seven times higher than that of rats in the MRC_L group. Rats treated with MRC received oral doses 6 days a week for a total of 8 weeks. Their body weights were measured once a week during the treatment period. After administration, each rat was deeply anesthetized using 5% isoflurane and blood was collected through cardiac puncture. After the heart was confirmed to have stopped, each rat was sacrificed by cervical dislocation. The uterus, liver, and femur were collected and weighed. The standards for animal euthanasia are as follows: 1) When tumor growth or effects interfere with feeding or water supply; 2) If body weight has decreased by more than 20% of normal body weight; 3) Failure to respond to external stimuli; 4) When serious organ or systemic symptoms such as shortness of breath, severe diarrhea, vomiting, and spastic paralysis increase. The condition of all animals was checked daily, and no animals died during the animal testing period.
2.4. Micro-computed tomographyThe femur was fixed in neutral buffered formalin and the bone microstructures of the fixed femur samples were analyzed using a micro-computed tomography (micro-CT) system (SkyScan1176; Skyscan, Kontich, Belgium) and NRecon software (version 1.6.10.1; Bruker Corporation, Billerica, MA). Based on the obtained three-dimensional images, the structural parameters were measured to determine the bone morphological characteristics. The measured structural parameters included bone volume fraction (BV/TV), trabecular thickness (Tb.Th), trabecular separation (Tb.Sp), and trabecular number (Tb.N). The following imaging conditions were used: X-ray source 50 kV/200 μA, pixel size 8.9 μm, filter 0.5 mm aluminum (Al), rotation angle 180°, and 0.4° rotation steps.
2.5. The effect of MRC on cytotoxic and bone metabolic factors in serumBlood extracted through cardiac puncture was centrifuged at 29,739×g for 10 minutes. The supernatant containing the serum was collected and stored at −80°C until use. Levels of aspartate aminotransferase (AST), alanine transferase (ALT), and alkaline phosphatase (ALP) were determined by DKkorea (Seoul, South Korea). For TRAP activity, 50 µL of serum and 50 µL of TRAP solution (750 µL of 0.5 M acetate + 150 µL of tartrate solution + 4.93 mg p-nitrophenyl phosphate) were added to the wells of a 96-well plate and reacted at 37°C in a CO2 incubator for 1 hour. Fifty microliters of stop solution (0.5 M NaOH) was added to terminate the reaction. TRAP activity was measured at an absorbance at 405 nm using a microplate reader (Molecular Devices, Sunnyvale, CA).
2.6. Histological analysisThe fixed femur was decalcified in ethylenediaminetetraacetic acid for 4 weeks at room temperature (20°C-22°C) and washed for 24 hours. Each femur tissue was embedded in paraffin and sectioned at a thickness of 5 μm using a model RM2125 RTS microtome (Leica Biosystems, Wetzlar, Germany). To observe inhibits of trabecular loss, the sectioned femur was sequentially hydrated by immersion in xylene, 100% ethanol, 90% ethanol, 70% ethanol, and deionized water. The dehydrated tissue was stained with Harris hematoxylin (10 minutes) and washed with running water (15 minutes), 1% HCl alcohol, 0.5% ammonia water (1 minute), and eosin (10 seconds). The stained femur tissue was sequentially dehydrated in 70%, 90%, 100% ethanol, and xylene, and sealed using balsam. Changes in tissue parameters, such as femoral head area, were observed via inverted light microscopy at magnifications of 40× and 100× (Olympus Corporation, Tokyo, Japan). The trabecular area was measured using Image J software (version 1.53a; National Institutes of Health, Bethesda, MD).
2.7. IHC stainingParaffin-embedded femur tissues were sectioned and rehydrated by immersion in xylene, followed by a series of graded ethanol solutions (100%, 90%, and 70%), and finally with deionized water. To inhibit endogenous peroxidase activity, the hydrated femur tissues were treated with 0.3% hydrogen peroxide in methanol. After the inhibition of endogenous peroxidase, nonspecific reactions were blocked for 1 hour using normal serum. The femur tissues were washed three times with PBS and incubated with primary antibody (NFATc1) at 4°C overnight. The tissues were then incubated with secondary antibodies at room temperature for 1 hour. An ABC kit was used to incubate the tissues for 30 minutes at room temperature, followed by staining with a DAB solution. Hematoxylin was used as a counterstain. Stained tissues were observed using a model BX51 optical microscope (Olympus) at 100× and 200× magnifications.
2.8. Cell culture and cell viabilityRAW 264.7 cells obtained from the Korean Cell Line Bank (KCLB No. 40071, Seoul, Korea) were cultured in DMEM containing 10% FBS and 1% P/S at 37°C in a 5% CO2 atmosphere with constant humidity. To determine the effect of MRC and MRCW on RAW 264.7 cell toxicity, cell viability was evaluated using the CCK-8 assay. RAW 264.7 cells were seeded in wells (100 µL containing 5 × 10³ cells/well) in a 96-well plate and stabilized at 37°C overnight. The cells were then exposed to DMEM without FBS containing various concentrations of MRC (125, 250, 500, and 1000 µg/mL) and MRCW (125, 250, and 500 µg/mL) for 24 hours. Each well then received 10 µL of CCK-8 solution and the plate was incubated at 37°C in a CO2 incubator for 2 hours. The absorbance of each well was measured at 450 nm using a microplate reader (Molecular Devices, Sunnyvale, CA). Cell viability was calculated as a percentage of the normal group. Intracellular toxicity was evident as cell viability ≤90%.
2.9. TRAP staining and activityCells were incubated in α-MEM supplemented with RANKL and various concentrations of MRC and MRCW for 5 days. After osteoclast differentiation was completed, the cells were fixed with 10% formalin for 10 minutes and washed with PBS. Multinuclear cells were stained for 1 hour according to the manufacturer’s instructions. The stained cells were dried and photographed under a light microscope. Cells with three or more nuclei showing a red TRAP-positive reaction were considered osteoclasts. TRAP activity in the culture was measured in the same manner as serum TRAP activity.
2.10. Actin ring stainingTo investigate the inhibitory effect of MRC on F-actin ring formation in osteoclasts, RAW 264.7 cells were treated with RANKL and MRC for 5 days at 37°C. Subsequently, the cells were washed with PBS, fixed with 4% paraformaldehyde, and permeabilized with 0.1% Triton X-100. Osteoclast actin rings were visualized using Acti-stain™ 488 Fluorescent Phalloidin and DAPI staining. Cell images were captured using a Cellena fluorescent microscope (Logos Biosystems, Seoul, South Korea) at 200× magnification and analyzed using ImageJ.
2.11. Western blot analysisRAW 264.7 cells were treated with α-MEM containing RANKL and MRC and incubated for 24 hours. The RAW 264.7 cells were washed three times with DPBS, and total protein was extracted using RIPA buffer containing protease and phosphatase inhibitor cocktail. The extracted proteins were centrifuged at 16.1×g at 4°C for 20 minutes and the supernatant was collected for western blot analysis. The protein concentration was quantified using a bicinchoninic acid kit, and 30 µg of protein was sorted by protein size using 10% Sodium Dodecyl Sulphate-Polyacrylamide Gel Electrophoresis (SDS-PAGE). The resolved proteins were electro transferred to nitrocellulose membranes. The membranes were blocked with 5% skim milk for 1 hour to prevent nonspecific antibody binding. Primary antibodies to NFATc1, c-Fos, and β-actin were each diluted 1:1000 with 1% bovine serum albumin (BSA) and incubated at 4°C overnight. After completion of the reaction, the secondary antibody was diluted 1:10,000 with 1% BSA and allowed to react at room temperature for 1 hour. The protein expression level was measured using an ECL solution. Protein expression of each marker was quantified using ImageJ software and normalized to β-actin.
2.12. Reverse transcription-polymerase chain reactionRAW 264.7 cells were seeded at 2 × 10⁵ cells/well in a six-well-plate and stabilized at 37°C for 24 hours. The cells were then incubated with α-MEM containing RANKL and MRC for 4 days, and the culture was replaced once every 2 days. RNA was extracted using TRIzol solution (TaKaRa Bio) according to the manufacturer’s instructions. The extracted RNA was quantified to 2 μg using a NanoDrop 2000 spectrophotometer (Thermo Fisher Scientific). RNA (2 μg) was used to prepare to complementary DNA (cDNA) using a SuperScript II Reverse Transcriptase. Subsequently, PCR of cDNA was performed using Taq polymerase and primers. Primer sequences used in these experiments are listed in Table 1. PCR products were resolved by size using 1.2% agarose gel electrophoresis. mRNA expression was measured using Image J software and standardized using glyceraldehyde 3-phosphate dehydrogenase (GAPDH).
Table 1 - Primer sequences for RT-PCR analysis Gene Sequence (5′-3′) Cycles Annealing Tm (°C) Accession no. NFATc1 F: TGC TCC TCC TCC TGC TGC TC 32 58 NM_198429.2 R: CGT CTT CCA CCT CCA CGT CG c-Fos F: ATG GGC TCT CCT GTC AAC AC 40 58 NM_010234.3 R: GGC TGC CAA AAT AAA CTC CA OSCAR F: CTGCTGGTAACGGATCAGCTCCCCAGA 35 53 NM_001290377.1 R: CCAAGGAGCCAGAACCTTCGAAACT ATP6v0d2 F: ATGGGGCCTTGCAAAAGAAATCTG 44 55 NM_175406.3 R: CGACAGCGTCAAACAAAGGCTTGTA DC-STAMP F: TGGAAGTTCACTTGAAACTACGTG 40 60 NM_001289506.1 R: CTCGGTTTCCCGTCAGCCTCTCTC TRAP F: GTGCATGACGCCAATGACAAG 31 58 NM_006242694.2 R: TTTCCAGCCAGCACGTACCA MMP-9 F: CGACTTTTGTGGTCTTCCCC 30 58 NM_013599.4 R: TGAAGGTTTGGAATCGACCC CA2 F: CTCTCAGGACAATGCAGTGCTGA 32 58 NM_001357334.1 R: ATCCAGGTCACACATTCCAGCA CTsK F: AGGCGGCTATATGACCACTG 26 58 NM_007802.4 R: CCGAGCCAAGAGAGCATATC GAPDH F: ACTTTGTCAAGCTCATTTCC 30 58 NM_008084.3 R: TGCAGCGAACTTTATTGATGCA2 = carbonic anhydrase 2; CTsK = cathepsin K; DC-STAMP = dendritic cell–specific transmembrane protein; GAPDH = glyceraldehyde 3-phosphate dehydrogenase; MMP-9 = matrix metalloproteinase-9; NFATc1 = nuclear factor of activated T cells 1; OSCAR = osteoclast-associated receptor; RT-PCR = reverse transcription-polymerase chain reaction; TRAP = tartrate-resistant acid phosphatase.
Chlorogenic acid was analyzed on an Alliance 2695 HPLC system (Waters, Waltham, MA) equipped with a 2996 Photo Diode Array Detector using an Xbridge C18 (250 × 4.6 mm, 5 μm) column. The flow rate was set at 1 mL/min for 40 minutes, with an injection volume of 10 µL for each sample. The mobile phase consisted of acetonitrile (solvent A) and water containing 0.1% formic acid (solvent B).
2.14. Statistical analysisAll experiments were conducted in triplicate to ensure reproducibility of the results. Statistical analysis was performed using GraphPad Prism (version 9.00; GraphPad Software Inc., San Diego, CA). The data are expressed as mean ± standard error of the mean (SEM). Statistical significance was determined via one-way analysis of variance followed by Tukey’s post hoc test, and p values <0.05 were considered statistically significant.
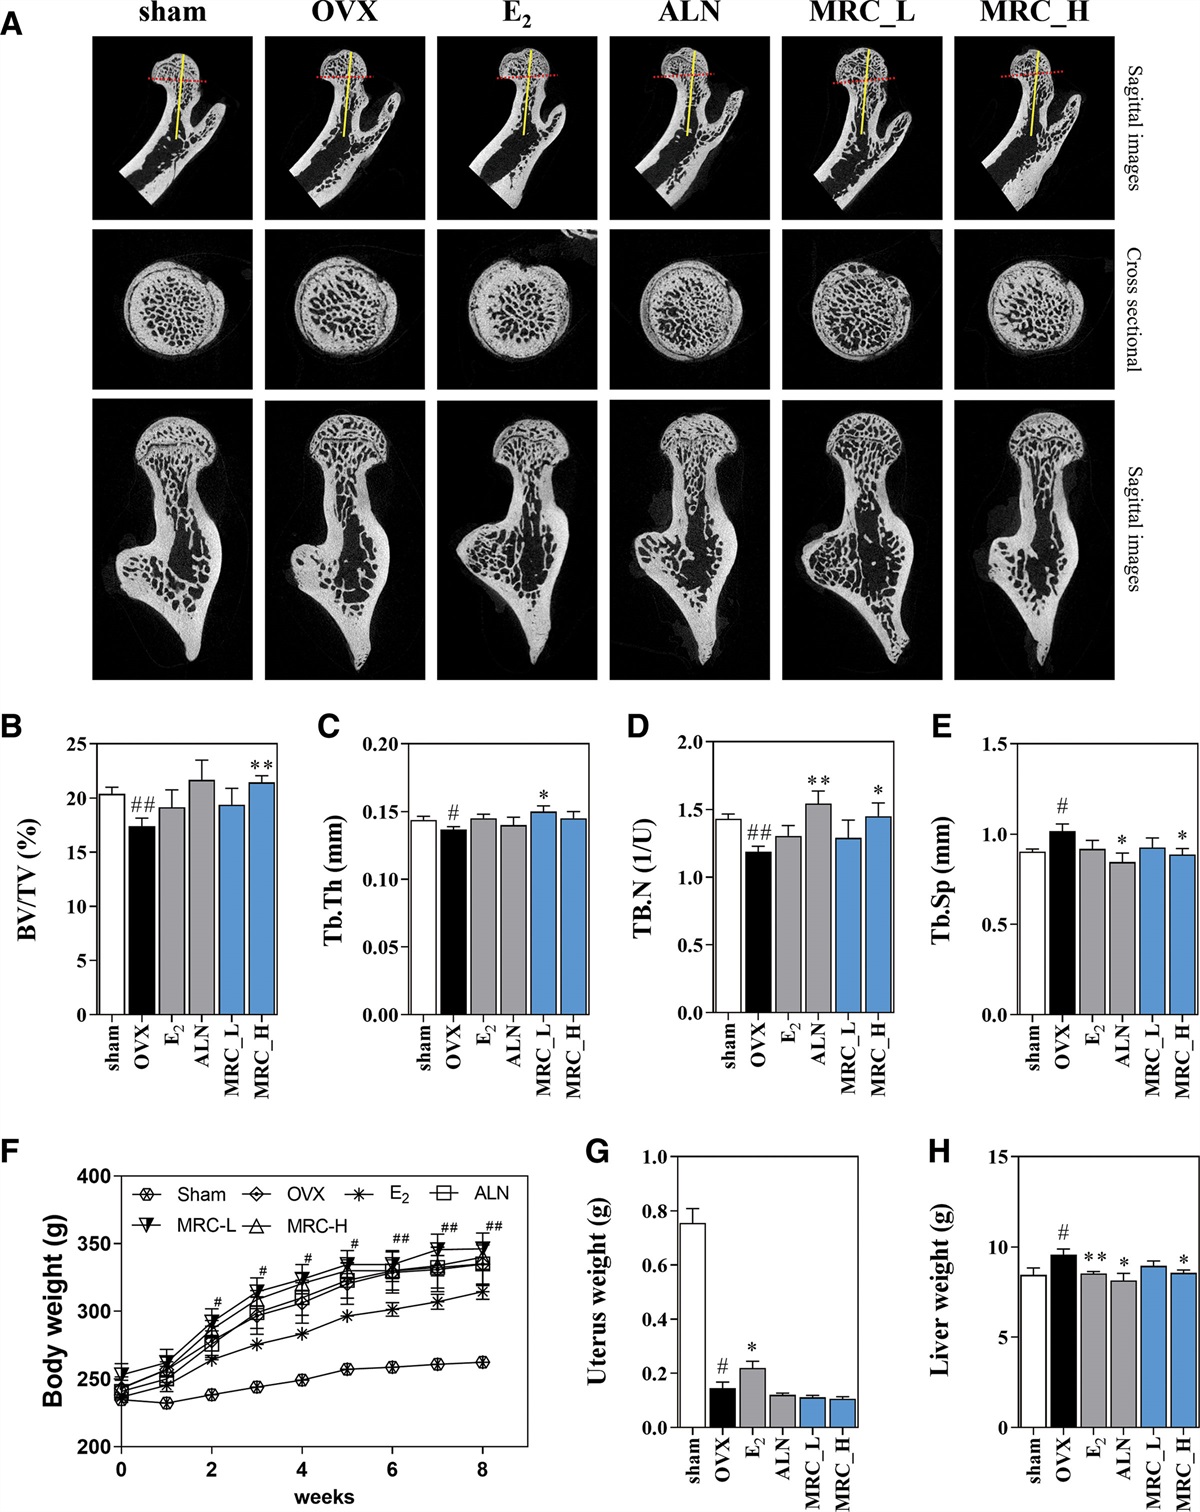
3. RESULTS 3.1. MRC inhibits bone loss in an OVX-induced model of OVX-induced osteoporosisBone microstructure was analyzed using micro-CT to confirm the effect of MRC on OVX-induced osteoporosis. Bone mineral density was decreased in the OVX group compared with the sham group. The bone mineral density of the femoral head was increased in the E2, ALN, MRC_L, and MRC_H groups compared with that in the OVX group (Fig. 1A). Bone microstructure analysis revealed that BV/TV was significantly reduced in the OVX group compared with the sham group. BV/TV was increased in the E2 and ALN groups compared with the OVX group, but the difference was not significant. In the MRC_H group, BV/TV was significantly higher than that in the OVX group (Fig. 1B). The OVX group exhibited a significant reduction in Tb.Th compared with the sham group. The positive control groups E2 and ALN did not significantly increase Tb.Th compared with the OVX group, but the MRC_L group showed a significant increase in Tb.Th compared with the OVX group (Fig. 1C). The OVX group showed a significant reduction in Tb.N compared with the sham group. The ALN and MRC_H positive control groups displayed significantly increased Tb.N compared with the OVX group (Fig. 1D). Tb.Sp was significantly increased in the OVX group. Tb.Sp was significantly decreased in the ALN and MRC_H groups compared with the OVX group. In the E2 and MRC_L groups, Tb.Sp decreased compared with the OVX group, but this was not significant (Fig. 1E). Body weights of the rats were measured once weekly during the 8-week oral administration of MRC following perimenopausal OVX. Two weeks after surgery, the weight of the OVX group was significantly higher than that of the sham group. The weight of the E2 group had decreased compared with that of the OVX group 3 weeks after administration, but the difference was not significant. The weight increases of the ALN, MRC_L, and MRC_H groups were not changed significantly compared with the OVX group (Fig. 1F). Uterine weight was significantly reduced in the OVX group compared with that in the sham group, and that in the E2 group was significantly increased compared with that in the OVX group. However, no significant changes in the uterine weights were observed in the ALN, MRC_L, and MRC_H groups (Fig. 1G). Liver weight was significantly increased in the OVX group compared with the sham group, and significantly decreased in the E2, ALN, and MRC_H groups compared with the OVX group. However, the liver weight of the MRC_L group decreased but did not change significantly (Fig. 1H). The increase in liver weight is highly influenced by body weight changes and is considered to be in the normal range if the liver weight to body weight ratio is within 15%. In this study, we found that the liver weight of all groups was within 15% of body weight.
 Fig. 1:
 Effect of MRC on the bone morphometric parameters in OVX-induced postmenopausal osteoporosis model. A, The osteoporosis-induced femur was captured using a sagittal image and cross-sectional method through micro-CT analysis. The (B) BV/TV, (C) Tb.Th, (D) Tb.Sp, (E) Tb.N were determined using the micro-CT data and CT analyzer software. (F) Body weight was measured weekly for a duration of 8 wk. The (G) uterus and (H) liver weight was measured after being sacrificed. The data are expressed as the mean ± SEM. The statistical significance; #p < 0.05 and ##p < 0.01 vs the sham group, *p < 0.05 and **p < 0.01 vs the OVX group. ALN = alendronate; BV/TV = bone volume/total volume; E2 = 17β-estradiol; Micro-CT = micro-computed tomography; MRC = Mori Radicis Cortex; OVX = ovariectomy; Tb.N = trabecular number; Tb.Sp = trabecular separation; Tb.Th = trabecular thickness.
3.2. Biochemical analysisSerum AST and ALT levels did not change significantly in the sham, OVX, E2, ALN, MRC_L, and MRC_H groups (Fig. 2A, B). Serum ALP levels no significant changes in the E2 and ALN groups compared with the OVX group. But the MRC_L and MRC_H groups were significantly reduced compared with the OVX group (Fig. 2C). Analysis of TRAP levels in the serum samples revealed no significant changes in the OVX, E2, ALN, and MRC_L groups, but a significant decrease was observed in the MRC_H group compared with the OVX group (Fig. 2D).
 Fig. 2:
 The effects of MRC on the level of AST, ALT, ALP, and TRAP activity in serum. The level of (A) AST, (B) ALT, (C) ALP, and (D)TRAP in serum was measured using ELISA. The data are expressed as the mean ± SEM. The statistical significance; *p < 0.05 and **p < 0.01 vs the OVX group. ALN = alendronate; ALP = alkaline phosphatase; ALT = alanine transaminase; AST = aspartate aminotransferase; E2 = 17β-estradiol; ELISA = enzyme-linked immunosorbent assay; MRC = Mori Radicis Cortex; OVX = ovariectomy; TRAP = tartrate-resistant acid phosphatase.
3.3. Inhibitory effect of MRC on bone loss and NFATc1 expression in femoral tissueHistological and histochemical changes in the femoral head were observed using hematoxylin and eosin (H&E) and IHC staining (Fig 3A). H&E staining was performed to determine the extent of femoral bone loss. However, the E2, ALN, MRC_L, and MRC_H groups showed no significant bone loss compared with the OVX group but indicated a decreasing trend (Fig. 3B). The expression of NFATc1 in the femoral head was measured by IHC staining. The expression of NFATc1 in the femoral head was higher in the OVX group than in the sham group. This increase was significantly reduced by treatment with the E2 and MRC_H group (Fig. 3C).
 Fig. 3:
 Effect of MRC on trabeculae, osteoclast, and histopathological examinations in OVX-induced model. (A) The trabecular area was assessed by performing H&E staining of femoral tissues. And NFATc1 was measured through IHC staining of femoral tissue. The numbers of (B) trabecular area and (C) NFATc1-positive cells was quantified by ImageJ. The data are expressed as the mean ± SEM. The statistical significance; #p < 0.05 and **p < 0.01 vs the OVX group. ALN = alendronate; E2 = 17β-estradiol; H&E = hematoxylin and eosin; IHC = immunohistochemistry; MRC = Mori Radicis Cortex; NFATc1 = nuclear factor of activated T cells 1; OVX = ovariectomy.
3.4. MRC decreases the number of TRAP-positive cells and disrupts the F-actin ring that is essential for osteoclast cytoskeletal structure in RANKL-induced RAW 264.7 cellTRAP staining confirmed that MRCW reduced TRAP-positive multinucleated cells at 500 μg/mL compared with RANKL-treated group (Supplementary Figure S1A, https://links.lww.com/JCMA/A249). Furthermore, measurement of TRAP activity showed that MRCW significantly inhibited it at 500 μg/mL compared with RANKL-treated group (Supplementary Figure S1B, https://links.lww.com/JCMA/A249). MRCW did not show cytotoxicity at 125, 250, and 500 μg/mL (Supplementary Figure S1C, https://links.lww.com/JCMA/A249). However, when comparing the ability of the MRC and MRCW to inhibit osteoclast differentiation, it was found that the MRC was more effective in inhibiting osteoclasts than the MRCW. Therefore, we used MRC to verify its antiosteoporosis efficacy.
TRAP staining was performed to determine the ability of MRC to inhibit osteoclast differentiation. In the RANKL-treated group, TRAP-positive multinucleated cells were stained red, and in the MRC-treated group, TRAP-positive multinucleated cells were reduced in a concentration-dependent manner (Fig. 4A). Actin rings are essential for osteoclast differentiation, and their areas and numbers were analyzed. In the RANKL-treated group, the actin ring area increased; these increases were lower after the MRC treatment (Fig. 4B). After differentiation of RAW 264.7 cells into osteoclasts, TRAP activity in the culture medium was assessed and the number of multinucleated cells was quantified. RANKL-treated group displayed significantly increased TRAP activity and multinucleated cell numbers compared with the nontreated group. Treatment with 500 μg/mL MRC resulted in significantly decreased TRAP activity and multinucleated cell numbers compared with the RANKL-treated group (Fig. 4C, D). The number of actin rings was significantly increased in the RANKL-treated group, but was significantly decreased compared with the RANKL-treated group after the cells were treated with 250 and 500 μg/mL MRC (Fig. 4E).
 Fig. 4:
 Effect of MRC on RANKL-induced osteoclastogenesis and F-actin ring formation. A, TRAP-positive cells were detected by a TRAP staining kit and imaged under an inverted microscope at a magnification of ×100. B, The F-actin rings were captured using a microscope (magnification ×100). C, TRAP activity was read at 405 nm via an ELISA reader. D, Osteoclasts were counted as multinucleated cells stained in red and containing at least three nuclei. E, The F-actin rings number was quantified. F, The viability of RAW 264.7 cells treated with MRC was assessed using a CCK-8 assay kit. The data are expressed as the mean ± SEM. The data are expressed as the mean ± SEM. The statistical significance; #p < 0.05 and ##p < 0.01 vs the nontreated cells, *p < 0.05 and **p < 0.01 vs the RANKL-treated group. ELISA = enzyme-linked immunosorbent assay; MRC = Mori Radicis Cortex; RANKL = receptor activator of nuclear factors κB ligand; TRAP = tartrate-resistant acid phosphatase.
Analysis of the cytotoxicity of MRC in RAW 264.7 cells using the CCK-8 kit revealed the absence of cytotoxicity with 62.5, 125, 250, and 500 μg/mL MRC and induction of cytotoxicity with 1000 μg/mL MRC (Fig. 4F). These experimental results indicate that the inhibitory effect of MRC on osteoclasts at concentrations of 125, 250, and 500 μg/mL was not due to cytotoxicity.
3.5. Effect of MRC on essential factor of osteoclast differentiationThe NFATc1 and c-Fos expression, which are essential factors for osteoclast differentiation, were measured using western blotting and RT-PCR. When RAW 264.7 cells were treated with RANKL, the expression of protein and mRNA of NFATc1 increased, while treatment with MRC decreased the expression of NFATc1 (Fig. 5A). Quantification of expression using β-Actin and GAPDH showed that the protein and mRNA expressions of NFATc1 were significantly decreased in the MRC 500 μg/mL compared with the RANKL-treated group (Fig. 5B, C). Furthermore, c-Fos protein and mRNA expression significantly increased in the RANKL-induced group. However, when MRC was administered, c-Fos expression was reduced compared with that in the RANKL-induced group (Fig. 5D). Quantification of c-Fos using β-actin and GAPDH showed that the expression of the protein was significantly reduced at 250 and 500 μg/mL MRC, and the mRNA expression was significantly reduced at 125, 250, and 500 μg/mL of MRC (Fig. 5E, F).
 Fig. 5:
 The effect of MRC on the expression of NFATc1/c-Fos in RANKL-induced RAW 264.7 cells. The expression levels of NFATc1 were evaluated by conducting Western blotting and RT-PCR, respectively (A). NFATc1 protein levels were normalized to β-actin (B), while NFATc1 mRNA levels were normalized to GAPDH (C). The expression levels of c-Fos were evaluated by conducting Western blotting and RT-PCR, respectively (D). c-Fos protein levels were normalized to β-actin (E), and mRNA levels were normalized to GAPDH (F). The data are expressed as the mean ± SEM. The statistical significance; #p < 0.05 and ##p < 0.01 vs the nontreated cells, *p < 0.05, and **p < 0.01 vs the RANKL-treated group. GAPDH = glyceraldehyde 3-phosphate dehydrogenase; MRC = Mori Radicis Cortex; NFATc1 = nuclear factor of activated T cells 1; RT-PCR = reverse transcription-polymerase chain reaction.
3.6. Effect of MRC on osteoclast gene expressionThe effects of MRC on the osteoclast differentiation indicators osteoclast-associated receptor (OSCAR), ATP6v0d2, and dendritic cell-specific transmembrane protein (DC-STAMP) were analyzed by RT-PCR (Fig. 6A). Quantification of each indicator based on GAPDH showed that the mRNA expression of OSCAR, ATP6v0d2, and DC-STAMP was significantly increased in the RANKL-treated group compared with the expression in the nontreated group. Treatment with 500 μg/mL MRC significantly suppressed OSCAR expression compared with the RANKL treatment group (Fig. 6B). Furthermore, gene expression of ATP6v0d2 tended to decrease, but the difference was not significant. The expression of DC-STAMP was significantly suppressed compared with the RANKL treatment group at an MRC concentration of 500 μg/mL (Fig. 6C, D). The mRNA expression of the bone resorption markers TRAP, matrix metalloproteinase-9 (MMP-9), carbonic anhydrase 2 (CA2), and cathepsin K (CTsK) was confirmed through electrophoresis (Fig. 6E) and quantified by the inclusion of GAPDH. The expression of TRAP was significantly suppressed at 250 and 500 μg/mL MRC, and MMP-9 expression was significantly suppressed at 125, 250, 500 μg/mL MRC (Fig. 6F, G). The expression of CA2 was significantly reduced using 250 and 500 µg/mL MRC compared with the RANKL-treated group (Fig. 6H). CTsK expression was significantly increased in the RANKL-treated group compared with that in the nontreated group, whereas MRC treatment did not show a significant decrease compared with that in the RANKL-treated group (Fig. 6I).
 Fig. 6:
 Effect of MRC on osteoclast differentiation and bone resorption-related gene expression. A, The mRNA expression of OSCAR, ATP6v0d2, DC-STAMP was detected by RT-PCR. B-D, OSCAR, ATP6v0d2, DC-STAMP were normalized to GAPDH. E, The mRNA expression of TRAP, MMP-9, CA2, CTsK was detected by RT-PCR. F-I, TRAP, MMP-9, CA2, CTsK were normalized to GAPDH. The data are expressed as the mean ± SEM. The statistical significance; #p < 0.05 and ##p < 0.01 vs the nontreated cells, *p < 0.05, and **p < 0.01 vs the RANKL-treated group. ATP6v0d2 = ATPase H+ transporting V0 subunit D2; CA2 = carbonic anhydrase 2; CTsK = cathepsin K; DC-STAMP = dendritic cell–specific transmembrane protein; GAPDH = glyceraldehyde 3-phosphate dehydrogenase; MRC = Mori Radicis Cortex; OSCAR = osteoclast-associated receptor; RT-PCR = reverse transcription-polymerase chain reaction.
3.7. High-performance liquid chromatography analysis of MRCWe performed high-performance liquid chromatography (HPLC) to standardize MRC. Through literature review, we found that chlorogenic acid has been used to standardize MRC in various studies.13–16 The results of measuring the quality and purity of MRC are shown in Fig. 7. The chromatographic profile of the chlorogenic acid standard is shown in Fig. 7A. The retention time of chlorogenic acid in MRC was 17 to 18 minutes (Fig. 7B). MRC contained 1.49 mg/g chlorogenic acid.
 Fig. 7:
 HPLC of (A) chlorogenic acid, (B) MRC. HPLC = high-performance liquid chromatography; MRC = Mori Radicis Cortex.
4. DISCUSSIONOsteoporosis is caused by a variety of factors, the most common and prominent cause being a decrease in estrogen levels due to menopause.17 This leads to abnormal bone resorption by osteoclasts, disrupting the balance of bone metabolism and resulting in significant bone loss, particularly in the femur, forearm, and vertebrae.18 Consequently, the risk of fractures in these bones is significantly increased.19 Even minor impacts can lead to fractures, thus considerably impacting the quality of life for individuals with osteoporosis.20,21 In the OVX-induced animal model, osteoporosis is induced via surgical removal of ovaries.22 Approximately 3 months after OVX, femur and lumbar spine bone density decrease, leading to osteoporosis.23 This model closely resembles female osteoporosis due to decreased estrogen after menopause and is a Food and Drug Administration (FDA)-approved nonclinical model of osteoporosis used to evaluate the efficacy of bone loss prevention and treatment agents.24 Osteoclasts are multinucleated giant cells derived from monocytes/macrophages of the hematopoietic lineage whose main function is bone resorption.25 The RAW 264.7 cells used in this study are a murine monocyte/macrophage cell line that is sensitive and rapidly differentiates into osteoclasts in response to the RANKL tumor necrosis factor superfamily cytokine.26,27 This model is similar to osteoclast metabolism in vivo and is used in various studies to verify effective inhibition mechanisms.28 Based on these considerations, our study utilized both the OVX animal model and the RANKL-induced cellular model.
Estrogen deficiency results in two clinical characteristics of postmenopausal osteoporosis. First, estrogen influences lipid metabolism and affects body fat mass and basal metabolic rate.29 However, after menopause, body weight increases rapidly due to a decrease in energy metabolism. Second, during menopause, the ovaries degenerate, leading to functional loss and the subsequent reductions in both the diameter and weight of the uterus.30,31 Consequently, the uterus serves as a morphological variable in successful models simulating menopause. In this study, the body weight of the OVX group increased significantly from 2 weeks after OVX; however, uterine weight was significantly lower in the OVX group than in the sham group. These findings confirm the successful implementation of OVX in all groups.
Decreased bone mineral density is a characteristic of osteoporosis.32 Recent studies have reported that positive changes in bone microstructure, including an increase in bone mineral density and other favorable changes, are important in alleviating osteoporosis.33 The use of micro-CT enables multidimensional analysis,34 facilitating the evaluation of BV/TV in the femur as well as morphological changes in the trabecular structure, such as TB.Th, Tb.Sp, and Tb.N. BV/TV is the ratio of trabecular bone volume to total volume, and provides an estimation of trabecular bone area.35 Tb.Th represents the average thickness of the trabecular structure, Tb.Sp indicates the average distance between trabeculae, and Tb.N represents the number of trabeculae per unit area. These indices enable the quantification of bone microarchitecture.36 In this study, BV/TV, Tb.Th, and Tb.N were significantly lower in the OVX group than in the sham group, w
Comments (0)