
Remember me


Iodine is an essential micronutrient and the major component of thyroid hormones; it is vital in pregnancy to promote normal fetal growth and neurodevelopment.1–3 Profound hypothyroidism, brain damage, congenital hypothyroidism, and low intelligence quotient may result from severe iodine deficiency in pregnancy, and these intellectual deficits can be reversed by iodine supplementation.1–5 Although the benefits of iodine supplementation in mild to moderate iodine deficiencies have not been universally demonstrated, studies have shown associations between increased pregnancy complications, mild thyroid alterations and worse intellectual development in children born to mothers with mild to moderate iodine deficiencies.1,2,5–9 The fetal thyroid does not mature until the beginning of the second trimester, making fetuses entirely dependent on maternal thyroid hormone during early pregnancy. The contribution of maternal thyroid hormones to the fetus continues until birth because of the relatively low fetal thyroid reserve even after the initiation of thyroid hormone production.2,3 The recommended daily iodine intake to meet the maternal and fetal thyroid hormone demand during pregnancy is 250 μg/d, which is 100 μg more than the usual recommended amount.10 Due to increased glomerular filtration rate and iodine loss from urine during pregnancy, the criterion to define iodine sufficiency in pregnancy is a population median urinary iodine concentration (UIC) of 150 to 249 μg/L, in contrast to the median UIC of 100 to 299 μg/L for the general population.11
According to the result of the Nutrition and Health Survey in Taiwan 2017 to 2020, the population median UIC was 104 μg/L for adults over 19 years old, indicating overall iodine sufficiency12; however, the population median UIC for pregnant women was 148 μg/L according to a national survey in 2017 to 2019, suggesting mild iodine deficiency in pregnancy.13 The process of thyroid hormone neurodevelopment includes two stages. The first stage of neuronal proliferation and migration starts in the first trimester and continues into the early part of the second trimester, whereas the second stage of neurogenesis, neuron migration, and myelination occurs later in pregnancy.14 It is important to maintain adequate iodine nutrition throughout gestation; however, pregnancy often remains unnoticed until 2 months after conception, and the nutritional awareness is generally low in early pregnancy. Most women recruited in previous surveys were in late pregnancy, and there was little information regarding iodine nutritional status in the initial critical period of neurodevelopment.15 A survey of pregnant women residing around metropolitan Taipei, where the population median UIC was 225.3 μg/L, included only 16 women in the first trimester out of a total of 257 pregnant women.16 Obstetricians in Taiwan have started to recommend routine nutritional supplement only after 12 weeks of gestation, which may result in different iodine statuses between early and late pregnancy.
In response to elevation of placental human chorionic gonadotropin, a maternal free T4 surge occurs that suppresses maternal thyroid stimulating hormone (TSH) at the end of the first trimester.15,17 This guarantees that maternal fT4 is sufficiently supplied to the fetus, but also causes misinterpretation of thyroid function tests if gestational thyroid function reference ranges are not used.15,17 The increased production of thyroxine-binding globulin during pregnancy also leads to elevated concentrations of total T4 and T3, necessitating a gestational thyroid function reference range for each thyroid hormone.15,17,18 The American Thyroid Association (ATA) has proposed that the upper limit of serum TSH in the first trimester should be 0.5 mIU/L lower than the usual upper limit for the nonpregnant population.18 However, there is wide variation in thyroid hormone values among different ethnicities and iodine statuses,18–42 and the ATA has also suggested the establishment of local regional gestational thyroid function reference ranges for each region18; these data are currently lacking in Taiwan. The present study aimed to evaluate the iodine nutritional status and thyroid function reference ranges in early pregnancy in Taiwan.
2. METHODS 2.1. Study design and data collectionThis study enrolled pregnant women who received prenatal checkups at Taipei Veterans General Hospital, Taiwan from March 2019 to July 2022. Eligible participants were women 8 to 13 + 6 weeks pregnant who were aged 20 years or older. Women currently taking antithyroid drugs or levothyroxine, with previous history of thyroid surgery or head and neck irradiation, and those scheduled for abortion, were excluded. Each participant provided a random spot urine sample for measurement of UIC and a blood sample for measurement of TSH, free T4, total T4, free T3, T3, antithyroglobulin antibodies (aTG), antithyroid peroxidase antibodies (aTPO), TSH receptor antibody (TR-Ab), and thyroglobulin. A food frequency questionnaire was completed on the day of sample collection. The study was approved by the local Institutional Review Board (IRB No. 2016-03-013A). Informed consent was obtained from each participant before enrollment.
2.2. Iodine and thyroid function measurementsUrine samples were stored in a −20°C environment before analysis. An Agilent 7700 Series inductively coupled plasma mass-spectrometry system (Agilent, Santa Clara, CA) was used for measuring UIC.43 Serum TSH, free T4, total T4, free T3, total T3, aTPO, and aTG were measured by an electrochemiluminescence immunoassay (cobase 801; Roche Diagnostics GmbH, Mannheim, Germany). TR-Ab was determined by a radioreceptor assay (E5010 Cobra Quantum gamma counter; Packard BioScience, Meriden, CT).
Hypothyroidism was defined as a TSH level above the upper limit and an fT4 below the lower limit, whereas subclinical hypothyroidism was defined as a TSH level above the upper limit with an fT4 level within the reference interval. The definition of hyperthyroidism was a TSH level below the lower limit with an elevated fT4 level, whereas subclinical hyperthyroidism was defined as a TSH level below the lower limit with an fT4 level within the reference interval.
2.3. Food frequency questionnaireThe food frequency questionnaire was similar to previously described versions.16 The first part of the questionnaire asked about the frequency of consumption of iodine-containing foods, including seaweed, fish, seafood other than fish, dairy products, and multivitamins, with response options of 1, 3, 5, 7 d/wk, or never. The second part of the questionnaire was designed to assess the types of salt (iodized or noniodized) used in the participants’ households.
2.4. Gestational thyroid function reference rangesThe gestational thyroid function reference ranges were determined based on the 2.5th and 97.5th percentiles of those studied women who tested negative on all thyroid autoantibodies (including aTG, aTPO, TR-Ab) and who had no known thyroid disease.18 Furthermore, due to a modification in the thyroid function test kit at Taipei Veterans General Hospital in October 2022, data from the first six women, whose thyroid function tests were conducted using different kits, were excluded from the analysis. Finally, 165 pregnant women were analyzed for gestational thyroid function references.
The percentage of women with thyroid dysfunction including overt dysfunction or the subclinical forms was calculated based on the thyroid function reference ranges derived from this study and compared to the nonpregnant reference ranges provided by the manufacturer.
2.5. Statistical analysisIodine status was determined by median UIC according to the recommendation from the United Nations International Children’s Emergency Fund.11 UIC and intake frequencies were not normally distributed and were therefore presented as medians with interquartile range, while the other continuous variables were expressed as mean ± SD. The Mann-Whitney U test and Kruskal-Wallis test was used for comparison between continuous variables. Categorical variables were presented as numbers with percentages and assessed by Pearson’s Chi-square test. Variables with a p value ≤0.1 in univariate analysis were included in multivariable logistic regression models to determine the independent risk factors associated with lower UIC. All data analysis was performed using the Statistical Package for the Social Sciences (SPSS) software, version 26.0 (IBM, Armonk, NY). A two-tailed p value of <0.05 was considered as statistically significant.
3. RESULTS 3.1. Characteristics of the study populationA total of 209 women with a mean age of 32.9 ± 4.4 years were enrolled. The characteristics of the study population are presented in Table 1. The median UIC was 160.9 μg/L (IQR: 105.0-246.2 μg/L), indicating overall iodine sufficiency. The positivity rates for aTG and aTPO were 8.7% (n = 18) and 8.2% (n = 17), respectively. Four women had positive TR-Ab and two were incidentally diagnosed with mild Graves’ disease.
Table 1 - Baseline demography of the studied population Variables Mean ± SD or n (%) Age, y 32.9 ± 4.4 Height, cm 160.6 ± 5.4 Weight, kg 59.6 ± 11.3 BMI, kg/m2 23.1 ± 4.0 Education (bachelor or above) 196 (93.8) Region (metropolis) 192 (91.9) Smoking 4 (1.9) Parity ≥2 87 (41.6) Positive miscarriage history 69 (33.0) Positive aTG 18 (8.7) Positive aTPO 17 (8.2) Positive TR-Ab 4 (1.9) TSH, mIU/L 1.09 ± 1.05 Free T4, ng/dL 1.3 ± 0.3 Total T4, μg/dL 10.1 ± 2.5 Total T3, ng/dL 141.0 ± 33.6 Free T3, pg/mL 3.5 ± 7.0 UICa, μg/L 160.9 (105.0-246.2)aTG = thyroglobulin antibody; aTPO = thyroid peroxidase antibodies; BMI = body mass index; n = number; TR-Ab = thyroid stimulating hormone receptor antibody; UIC = urinary iodine concentration.
aPresented by median and interquartile range.
The results of the food frequency questionnaire analysis are shown in Table 2. The most commonly ingested iodine-containing food type was dairy products, with 90.9% of participants ingesting a helping at least once per week and 71.8% of participants consuming them on at least 3 d/wk. Seaweed, seafood, and fish were consumed at least once per week by more than 60% of participants. The consumption of multivitamin was variable, with 34.0% of participants taking multivitamin every day, but 58.4% of participants never doing so.
Table 2 - Food frequency questionnaire: intake frequency (days/week) Food, n (%) 0 d 1 d 3 d 5 d 7 d Median (IQR) Seaweed 71 (34.0) 103 (49.3) 33 (15.8) 1 (0.5) 1 (0.5) 1 (0-1) Fish 50 (23.9) 85 (40.7) 64 (30.6) 6 (2.9) 4 (1.9) 1 (1-3) Seafood 78 (37.3) 77 (36.8) 50 (23.9) 3 (1.5) 1 (0.5) 1 (0-2) Dairy products 19 (9.1) 40 (19.1) 67 (32.0) 26 (12.5) 57 (27.3) 3 (1-7) Multivitamin 122 (58.4) 3 (1.4) 9 (5.3) 4 (1.9) 71 (34.0) 0 (0-7)Univariate analysis of factors associated with median UIC and its distribution are summarized in Table 3. Nulliparous women were associated with lower median UIC (146.2 vs 186.6 μg/L, p = 0.031) and higher likelihood for UIC <150 μg/L (51.6% vs 35.6%, p = 0.022). Compared to those with multivitamin intake, the median UIC was significantly lower in those who never consumed multivitamin (191.2 vs 146.4 μg/L, p = 0.010) and the percentage of women with UIC <150 μg/L was also significantly higher in those who did not ingest multivitamin (36.8% vs 50.8%, p = 0.044). The other demographic or dietary variables were not significantly associated with median UIC level or its distribution (Table 3).
Table 3 - Urinary iodine concentration and its distributions Characteristics Number, % Urinary iodine concentration, μg/L Median (IQR) p UIC <150 150 ≥ UIC p Total 209 160.9 (105.0-246.2) 94 105 Age, y 0.673 0.745 20-29 51 (24.4) 155.5 (108.4-221.0) 24 (47.1) 27 (52.9) 30-34 90 (43.1) 156.3 (115.3-233.4) 42 (46.7) 48 (53.3) 35 or above 68 (32.5) 188.7 (98.2-288.8) 28 (41.2) 40 (58.8) Body mass index, kg/m2 0.492 0.880 ≥27 32 (15.3) 181.1 (130.7-254.5) 14 (43.7) 18 (56.3) <27 177 (84.7) 160.0 (100.2-244.5) 80 (45.2) 97 (54.8) Education 0.067 0.101 Bachelor or above 196 (93.8) 159.3 (101.9-244.8) 91 (46.4) 105 (53.6) High school or below 13 (6.2) 215.7 (149.2-274.1) 3 (23.1) 10 (76.9) Residing area 0.763 0.857 Metropolis 192 (91.9) 161.4 (104.4-248.5) 86 (44.8) 106 (55.2) Suburb 17 (8.1) 160.0 (104.8-203.8) 8 (47.1) 9 (52.9) Parity 0.031 0.022 ≥2 87 (41.6) 186.6 (119.3-255.4) 31 (35.6) 56 (64.4) 1 122 (58.4) 146.2 (99.8-220.4) 63 (51.6) 59 (48.4) Positive miscarriage history 0.376 0.233 Yes (≥1) 69 (33.0) 177.2 (121.9-263.8) 27 (39.1) 42 (60.9) No (=0) 140 (67.0) 158.4 (99.7-239.3) 67 (47.9) 73 (52.1) Salt intake 0.178 0.433 Noniodized 85 (40.7) 152.6 (101.1-218.0) 41 (48.2) 44 (51.8) Iodized 124 (59.3) 171.1 (107.3-286.6) 53 (42.7) 71 (57.3) Seaweed 0.358 0.137 Yes (≥1) 138 (66.0) 176.8 (31.0-1284.8) 57 (41.3) 81 (58.7) No (=0) 71 (34.0) 144.2 (25.6-1075.1) 37 (52.1) 34 (47.9) Fish 0.799 0.628 Yes (≥1) 159 (76.1) 160.0 (27.6-1052.9) 73 (45.9) 86 (54.1) No (=0) 50 (23.9) 173.0 (34.7-1430.0) 21 (42.0) 29 (58.0) Seafood (except fish) 0.291 0.241 Yes (≥1) 131 (62.7) 155.5 (24.5-1130.7) 63 (48.1) 68 (51.9) No (=0) 78 (37.3) 185.9 (56.0-975.7) 31 (39.7) 47 (60.3) Dairy product 0.911 0.792 Yes (≥1) 190 (90.9) 160.5 (31.2-1041.4) 86 (45.3) 104 (54.7) No (=0) 19 (9.1) 184.9 (27.6-1583.9) 8 (42.1) 11 (57.9) Multivitamin intake 0.010 0.044 Yes (≥1) 87 (41.6) 191.2 (121.1-289.8) 32 (36.8) 55 (63.2) No (=0) 122 (58.4) 146.4 (94.0-222.7) 62 (50.8) 60 (49.2)IQR = interquartile range; UIC = urinary iodine concentration.
In multivariate analysis, nulliparous (adjusted OR: 2.02, 2.05, 2.02; 95% CI, 1.08-3.77, 1.10-3.81, 1.11-3.66; p = 0.027, 0.023, 0.022, respectively) and multivitamin nonusers (adjusted OR: 1.86, 1.85, 1.78; 95% CI: 1.04-3.34, 1.03-3.32, 1.004-3.71; p = 0.038, 0.039, 0.049, respectively) had increased odds of having UIC level <150 μg/L in all models (Table 4).
Table 4 - Multivariable analysis of the risk factors for UIC Variables Model 1 Model 2 Model 3 OR (95% CI) p OR (95% CI) p OR (95% CI) p Age, y 1.02 (0.95-1.09) 0.595 1.02 (0.95-1.09) 0.617 1.02 (0.96-1.10) 0.509 Body mass index, kg/m2 0.99 (0.92-1.06) 0.712 Education (ref: high school or below) 3.41 (0.86-13.48) 0.080 3.39 (0.86-13.34) 0.081 Parity (ref: ≥2) 2.02 (1.08-3.77) 0.027 2.05 (1.10-3.80) 0.023 2.01 (1.11-3.66) 0.022 Salt intake (ref: user) 1.01 (0.56-1.83) 0.978 1.01 (0.56-1.82) 0.979 Seaweed (ref: user) 1.55 (0.85-2.88) 0.158 1.53 (0.84-2.80) 0.164 Multivitamin intake (ref: user) 1.86 (1.04-3.34) 0.038 1.85 (1.03-3.32) 0.039 1.78 (1.00-3.17) 0.049The gestational reference ranges for thyroid function tests are presented in Table 5. The upper limit of serum TSH was 1.3 mIU/L lower in the first trimester than the upper limit provided by the manufacturer (pregnant vs nonpregnant range: 0.007-2.9 vs 0.27-4.2 mIU/L). The upper limits of free T4 and free T3 were higher than the respective nonpregnant values (pregnant vs nonpregnant free T4 range 0.93-2.2 vs 0.93-1.7 ng/dL; pregnant vs nonpregnant free T3 range: 2.3-5.0 vs 2.0-4.4 pg/mL). The ranges of T4 and T3 in the first trimester were also higher than the nonpregnant ranges (pregnant vs nonpregnant T4 range: 6.4-16.9 vs 5.1-14.1 μg/dL; pregnant vs nonpregnant T3 range: 88-231 vs 80-200 ng/dL).
Table 5 - Reference ranges for thyroid function tests First trimester Manufacture TSH, mIU/L 0.93 (0.007-2.9) 0.27-4.2 Free T4, ng/dL 1.3 (0.93-2.2) 0.93-1.7 Total T4, μg/dL 9.9 (6.4-16.9) 5.1-14.1 Free T3, pg/mL 3.0 (2.3-5.0) 2.0-4.4 Total T3, ng/dL 135 (88-231) 80-200TSH = thyroid stimulating hormone.
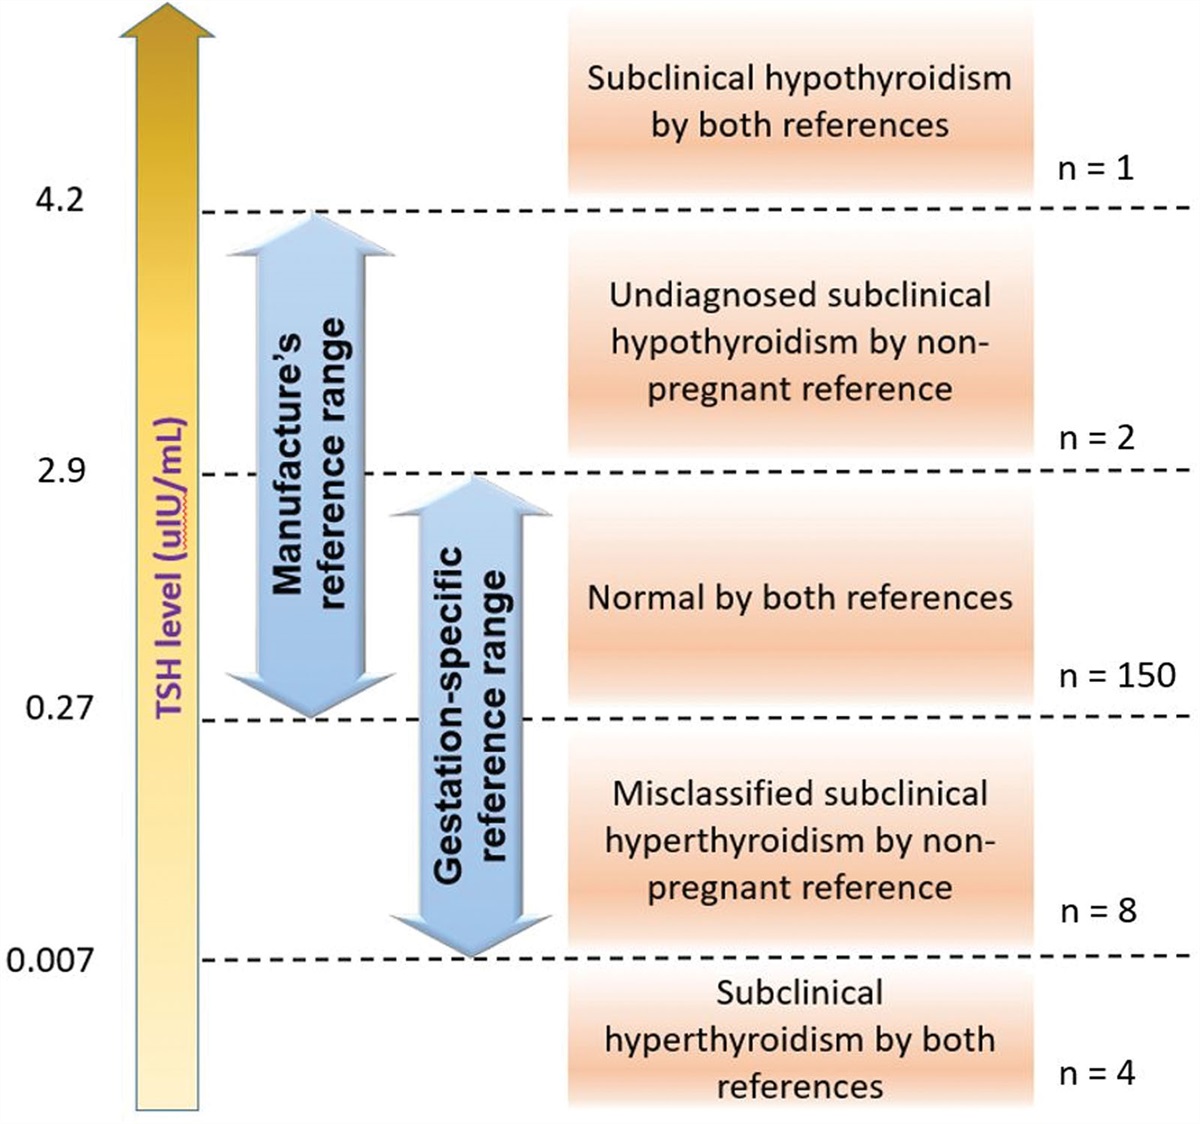
If the nonpregnant reference range of serum TSH was used, eight women (4.8%) would be misclassified as having subclinical hyperthyroidism, and two women (1.2%) with subclinical hypothyroidism would be missed. There was only one women (0.6%) whose TSH was above 4.2 mIU/L (nonpregnancy reference upper limit) and would be diagnosed with subclinical hypothyroidism by both references; whereas four women (2.4%) whose TSH was below 0.007 mIU/L would be diagnosed with subclinical hyperthyroidism by both references (Fig. 1).
 Fig. 1:
 Diagnosis of thyroid dysfunction by the gestational and manufacture’s TSH reference range. TSH = thyroid stimulating hormone.
4. DISCUSSIONTo the best of our knowledge, this is the first study to describe the iodine nutritional status and gestational thyroid function reference ranges in the first trimester of pregnancy in Taiwan. The overall median UIC of 160.9 μg/L indicated overall sufficient iodine status; however, certain subgroups such as nulliparous and multivitamin nonusers may still be at risk for iodine deficiency. The gestational thyroid function reference ranges significantly differed from the manufacturer’s reference range, and utilizing the nonpregnant reference range for diagnosing thyroid dysfunction in pregnancy may result in misclassifications that may impair proper patient care.
The result of the multivariate analysis revealed that nulliparous women and those who did not consume multivitamins were at higher risk for low UIC. A study conducted by Adalsteinsdottir et al44 also demonstrated that nulliparous women had lower UIC compared to those who have given birth. In 1971, Taiwan previously instituted a mandatory salt iodization strategy and eliminated endemic goiter45; however, the change of policy from mandatory to voluntary salt iodization has resulted in reoccurrence of iodine deficiency in 2013.46 Despite efforts to increase public awareness, increase the iodine content in fortified salts, and mandate labeling of iodine content of table salts, certain vulnerable populations such as pregnant women still remained at risk for iodine deficiency even after the iodine status has become borderline adequate for the general population.47 Most salt in Taiwan is noniodized, and it appears that Taiwanese people lack a stable source of iodine nutrition from foods. This has made iodine supplementation an important factor that influences iodine status, especially during pregnancy and lactation.13,48 Routine iodine supplementation in pregnancy has been suggested in some countries including the United States and Canada, where a daily 100 μg of additional iodine was recommended.18 In the present study, the median UIC for women without multivitamin intake was 146.4 μg/L, which indicates iodine deficiency. In contrast to the 79.4% of women mostly in the late trimester taking multivitamin in a previous study in 2018, only 41.6% of participants did so in the present study.16 This result is in line with obstetricians’ recommendation of starting supplementation after 12 weeks of gestation. However, this suggestion may need to be modified according to the result of the current study. In addition to the differences in multivitamin intake, the percentage of women ingesting seaweed, seafood, and fish were also higher in 2018 (seaweed: 79.4% vs 66.0%; seafood: 86.8% vs 62.7%; fish: 90.7% vs 76.1%). These dietary differences suggest that women in their second and trimesters received better nutritional support, and that iodine nutritional status in the first trimester can be improved by dietary adjustment.
The upper limit of serum TSH for pregnant women has been considered much lower than that for nonpregnant individuals, with reference intervals of 0.1 to 2.5 mIU/L in the first trimester and 0.2 to 3.0 mIU/L in the second and third trimesters suggested by the ATA in 2011.49,50 However, recent research in Chinese pregnant women revealed that the upper limit of serum TSH during weeks 7 to 12 of gestation was only slightly lower than that for weeks 4 to 6 (4.34 vs 5.31 mIU/L, respectively).19 As a result, the ATA adjusted their recommendation regarding upper limit of TSH in the first trimester to only 0.5 mIU/L below the nonpregnancy value in 2017.18 Our finding for the first trimester TSH upper limit (0.007-2.9 mIU/L) was closer to those reported in Japan (0.04-3.39 mIU/L) and the United States (0.16-2.82 mIU/L), but lower than the values reported in China (0.56-5.31 mIU/L), Korea (0.03-4.24 mIU/L), India (0.25-4.97 mIU/L), and Spain (0.12-5.76).
Comments (0)