
Remember me
In this exploratory post-hoc study, we compared ADEs reported by telephone interviews and self-report online surveys. The data were collected as part of the PREPARE study [10]. In the PREPARE study, the primary endpoint (‘incidence of clinically relevant ADRs’) was measured by using telephone interviews. Adverse drug reactions were extracted after a causality assessment between ADEs and the index drug (drug of interest) using the Liverpool causality assessment tool [11]. Because a causality assessment was not performed for online surveys, we chose to only include the raw ADE data of the telephone surveys (prior to the causality assessment).
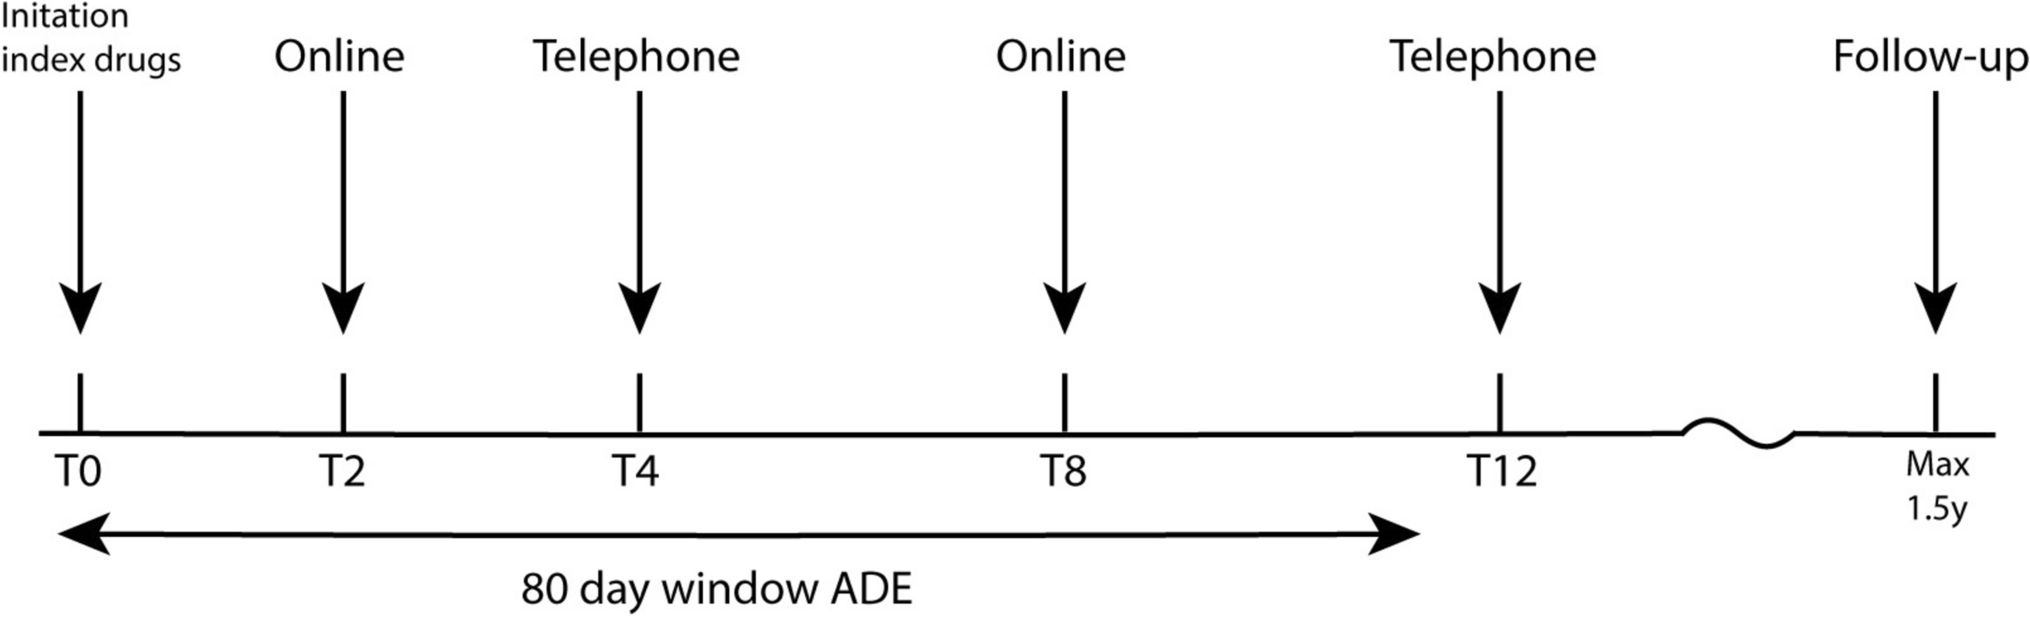
In our study, the index drugs (e.g., statins) were used as a reference to determine the onset of ADEs and the completion of the surveys. The patients received at least one dose of the index drug. As we compared ADEs within the same patients, drug-specific adverse effects were beyond the scope of this study. Adverse drug events, as elicited in the telephone interview, were collected using scripted interviews using open broad questions by healthcare professionals. This interview was started by asking if and what physical or emotional changes or complaints occurred in the patient since the initiation of the index drug, which was followed by additional questions regarding the specific adverse effect (e.g., onset and frequency) as well as the effect on daily activity. The telephone surveys were at initiation of the drug (t = 0, ± 1 week), at 4 weeks (± 2 weeks), at 12 weeks (± 3 weeks), and at the end of the follow-up (maximum 1.5 years) (Fig. 1).
Fig. 1
Timeline of the administration of the telephone interview and online survey from initiation of the index drug. The timepoints are depicted as weeks since initiation of the index drug. Adverse drug events (ADEs) experienced within the first 80 days, since the initiation of the index drug, were included in our analysis. Max maximum, y years
In addition to telephone-based event monitoring, self-report online surveys were conducted in a sub-cohort of patients during the PREPARE study. These online surveys were performed in collaboration with the Netherlands Pharmacovigilance Centre Lareb. The self-report online surveys were collected at 2 and 8 weeks after initiation of the index drug. These surveys included, similarly to the telephone surveys, questions on the type, severity, and frequency of the ADE (see the questionnaire in the Electronic Supplementary Material [ESM]). Both tools had a severity scale in which patients were asked to grade the severity of the adverse effect (1. Not severe, 2. Mild, 3. Moderate, 4. Severe, 5. Very severe). Additionally, to assess quality of life, the patients were asked to rate their health state on that day on a scale of 0 (the worst health state) to 100 (the best health state). The questions online were similar to the standardized telephone questionnaire used during the PREPARE study [10], making these datasets ideal for a comparison of the two survey tools.
In both methods, the patient were asked to only report new ADEs since the last survey of the same method. Because the timepoints differed, we decided to include only ADEs with an onset in the first 80 days from the initiation of the index drug, based on the last completion of the 8-week online survey. Moreover, ADEs that did not have a time of onset available were also excluded from the analysis (10% of ADEs reported via telephone after extraction ADEs experienced within 80 days).
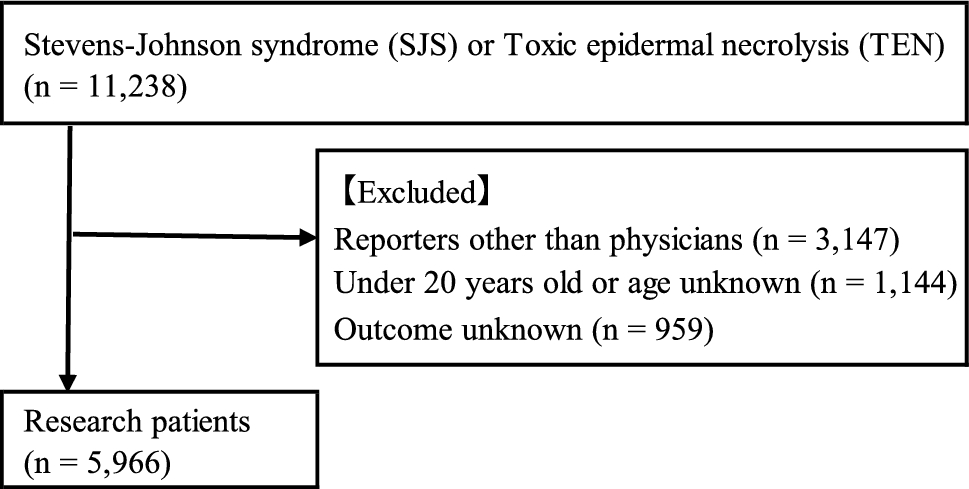
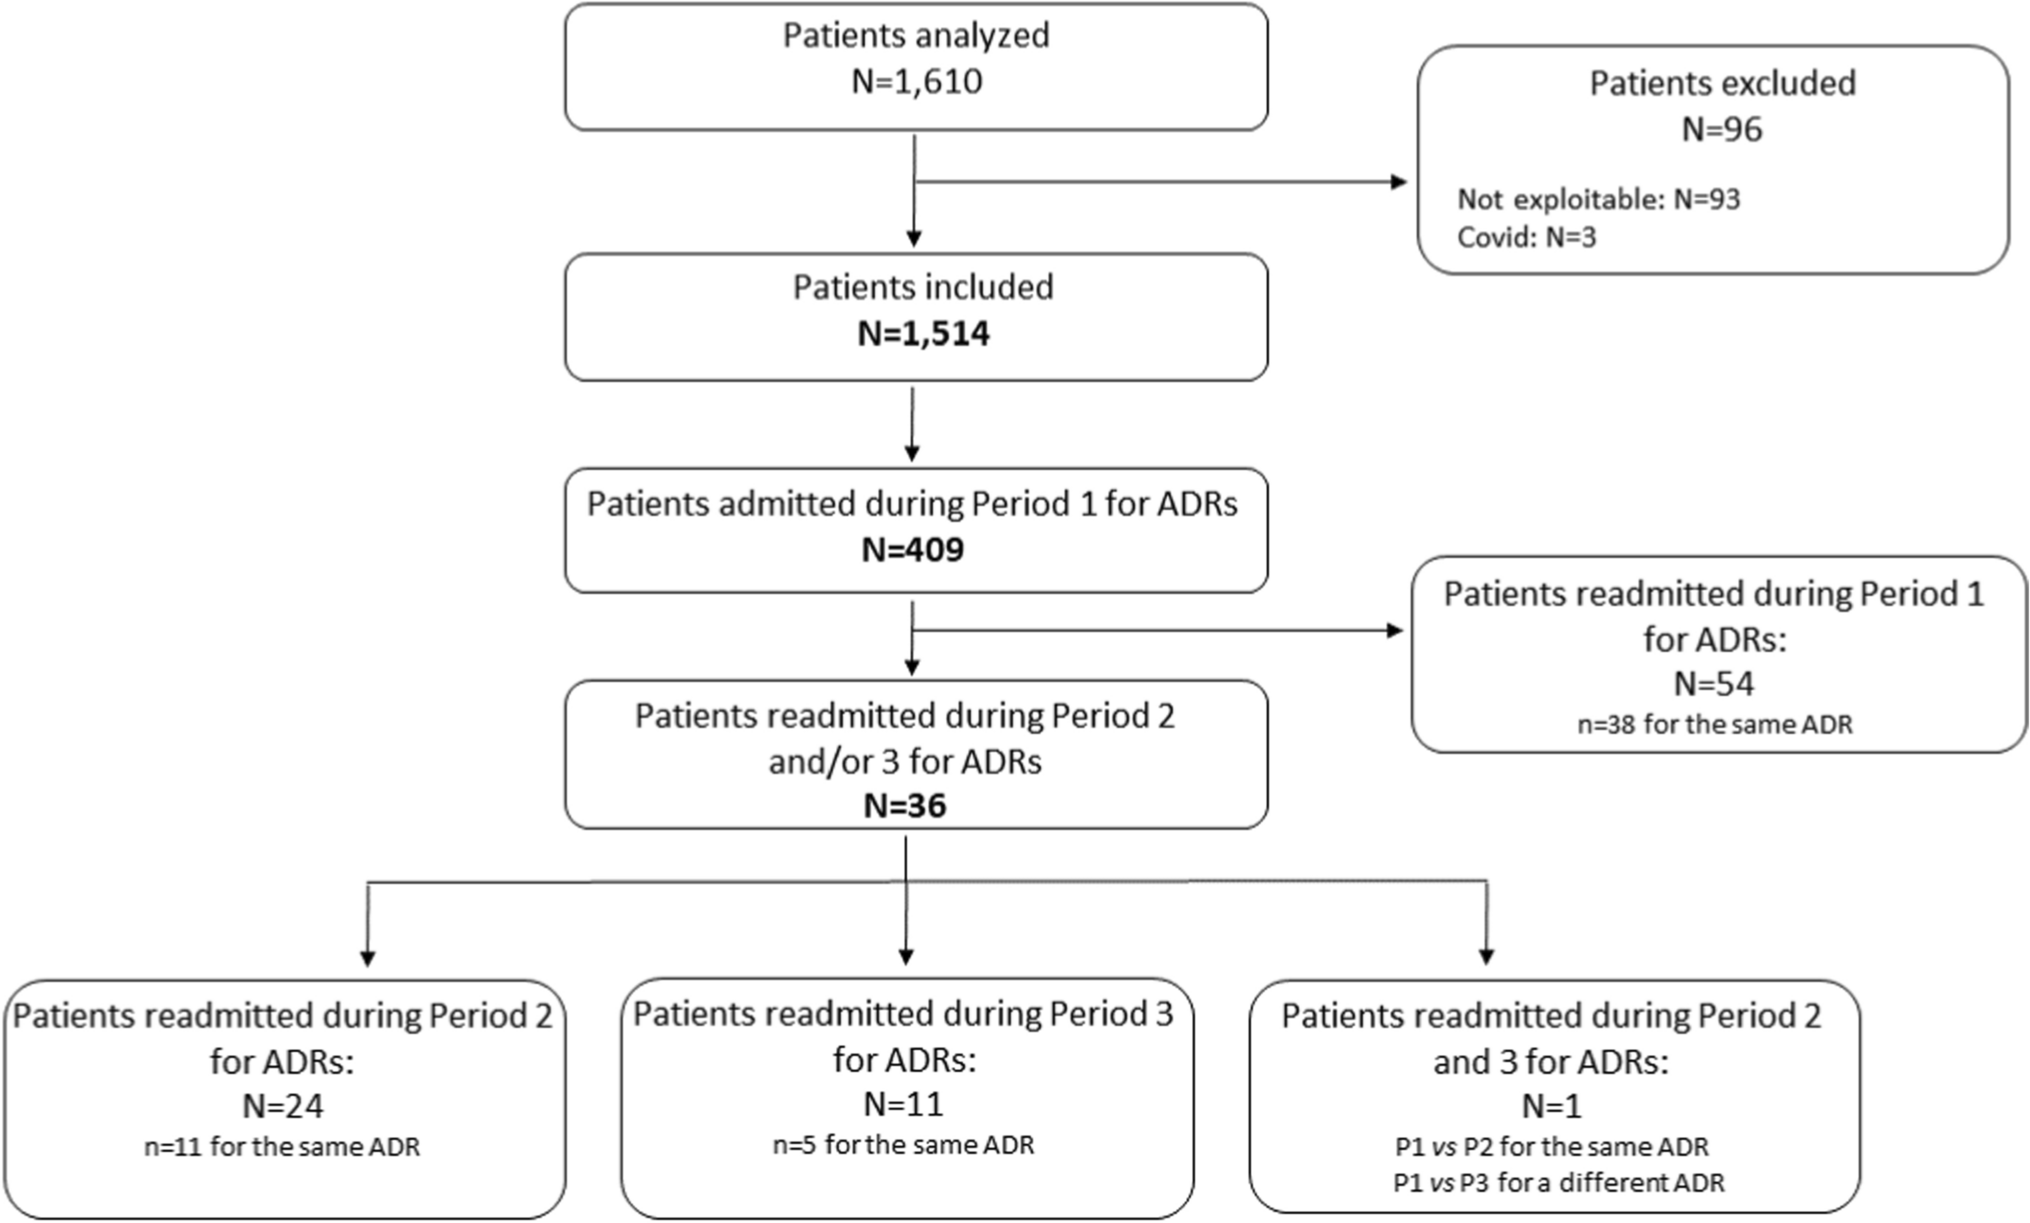
2.2 PatientsPatients in the PREPARE study were recruited in Austria, Greece, Italy, the Netherlands, Slovenia, Spain, and the UK. Most patients who completed both the telephone survey and the online survey were from community pharmacies in the Netherlands (76%). Therefore, this group was used for analysis in the current study. The remainder of the patients were mainly from Slovenia (17.8%) and Austria (4.3%), with a small number of patients from Spain (0.7%), Italy (0.1%), and Greece (0.1%) and no patients from the UK. The inclusion criteria for the primary analysis of the current study is that the patients had to have completed all telephone and online surveys and had to have reported at least one ADE online and via telephone (Fig. 2). For data visualization of the number, type, and severity of the ADEs, the requirement for the patients was to have reported at least one ADE using either tool (N = 351). The group consisted of 109 patients who only reported ADEs via telephone and 22 patients who only reported ADEs online (Fig. 2).
Fig. 2
Profile of the online survey patients. The patients were selected based on their participation in both the online survey and the telephone interviews. From the patients who completed both the telephone interview and online surveys, 76% were public pharmacy patients in the Netherlands. The patients who completed both surveys and reported adverse drug events (ADEs) online and via the telephone were included in the primary analysis (N = 220)
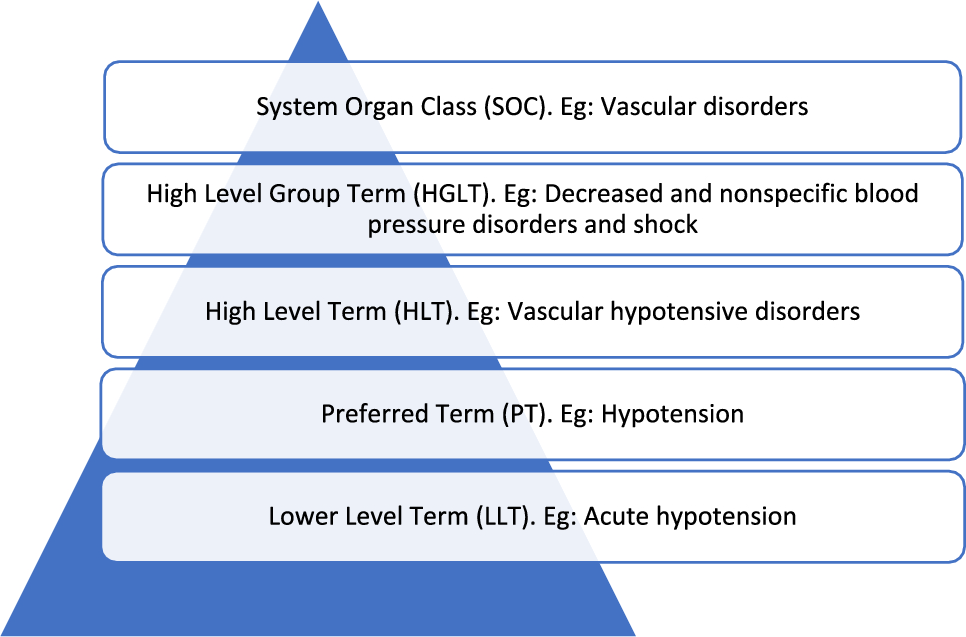
2.3 Data Pre-ProcessingThe type of the reported ADEs was categorized by using the Medical Dictionary for Regulatory Activities version 12.1 and an additional category named “sexual ADEs” (e.g., changes in libido, erectile dysfunction) was added by using ADEs reported in the categories “psychiatric disorders” and “reproductive system and breast disorders” related to sexual functioning. As only newly reported ADEs (not mentioned in the previous survey within the same tool) were used for the analysis, ADEs reported twice in the same tool were manually deleted for each patient. For some patients, severity scores were not provided for each ADE, which could not be considered.
2.4 Descriptive AnalysisThe data were graphically represented to allow visual perception of differences in the distribution of the number, type, and severity of the ADEs between telephone and online surveys. Absolute counts and percentages of ADEs are presented, allowing us to judge general sensitivity (absolute numbers) as well as relative sensitivity (percentages), i.e., preferential reporting using one of the tools, in this way, a potential loss of information can be assessed. The types of ADEs were compared as a percentage of the ADEs reported via telephone or online. Furthermore, severity distributions were visualized to assess whether patients reported different ADE severities across the tools.
2.5 Statistical AnalysisThe aim was to investigate differences between self-reported telephone interviews and online surveys for capturing ADEs. Contingency tables were used to quantify the number of patients who reported a type of ADE using one or both tools. This analysis consisted of multiple McNemar tests (one for each category) as well as the R2 (squared correlation), which was calculated per type of ADE to determine how well the online- and telephone-reported ADEs aligned. For a more meaningful comparison, we used the subset of patients who have reported at least one ADE for both tools. This subset can be used to assess whether patients willing to report in both modalities do so consistently. The R2 is the squared correlation and measures the percentage information of one tool that can be used to assess the other, i.e., an effective loss in sample size.
In addition, analyses were performed on the self-reported severities of the ADEs. To this end, we investigated the degree of agreement between the telephone and online surveys using (weighted) Cohen’s kappa. The latter will only consist of the ADEs with the highest severity score for each patient in both surveys.
All analyses were conducted in R (version 4.3.2). The tables were created using the ggplot2 and tables were created using packages gt, gtsummary, and kableExtra.
Comments (0)