
Remember me


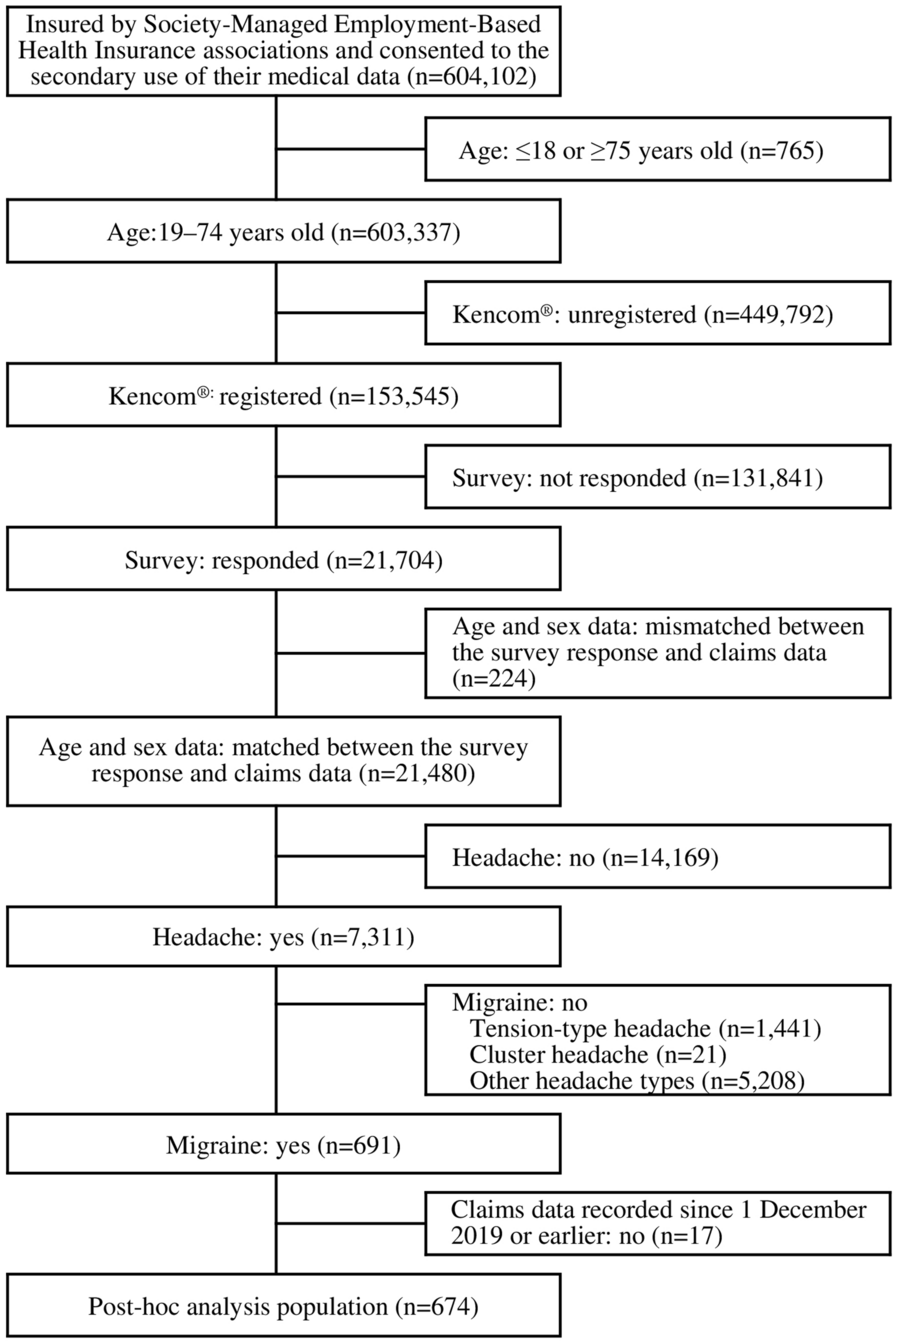

In total, 88 patients were screened, of whom 22 were not suitable for enrollment (did not meet the entry criteria, n = 15; withdrawn by parent or guardian, n = 6; unable to attend hospital because of COVID-19 restrictions, n = 1) (Fig. 2). Of the 66 eligible patients, all were enrolled and received study treatment. Sixty-two (93.9%) were girls and four (6.1%) were boys; median age 8.0 years (range 5–9 years), mean age (standard deviation [SD]) was 7.5 (0.9) years (Table 2). Mean (SD) body weight was 32.59 (7.35) kg, mean (SD) growth velocity was 9.82 (5.08) cm/year, and mean ratio (SD) of BA to CA was 1.27 (0.10). Six patients had experienced menarche at the time of enrollment. The distribution of patients across the Tanner development scale (combined girls [breast development] and boys [genital development]) was 0% (stage I), 43.9% (stage II), 43.9% (stage III), 10.6% (stage IV), and 1.5% (stages V). Mean baseline GnRH-stimulated peak values for LH and follicle-stimulating hormone (FSH) (± SD) were 27.82 ± 20.31 IU/L and 13.41 ± 5.20 IU/L, respectively.
Fig. 2
Patient disposition. *Unable to come to the hospital for screening period-related examination because of COVID-19 restrictions
Table 2 Baseline characteristicsAll 66 patients completed the month 6 visit and 65 completed the end of study month 12 visit. One girl was lost to follow-up before completing the month 12 visit. All 66 enrolled patients were included in the ITT, mITT, safety, and PK set populations. Four patients (three girls, one boy) were excluded from the PPS population owing to major protocol deviations that affected the primary efficacy endpoint outcome, and hence n = 62 in the PPS.
Hormonal SuppressionIn the analysis of the primary endpoint, all 66 patients in the ITT population (100%; 95% CI 94.6–100.0%) had LH suppression (≤ 5 IU/L) after GnRH stimulation at month 6 (Fig. 3). The lower limit of the 95% CI was higher than the null hypothesis (80%) and similar results were observed in the mITT and PPS populations. At month 3 and 12, 64 (97.0%; 95% CI 89.5–99.6%) and 65 patients (98.5%; 95% CI 91.8–100.0%) had LH suppression after GnRH stimulation, respectively.
Fig. 3
Proportion of patients with LH suppression (peak LH ≤ 5 IU/L). Intention-to-treat population. LH, luteinizing hormone. N.B. Two patients did not attend the month 3 visit because of COVID 19 restrictions. One patient was lost to follow-up after month 6 and did not attend the month 12 visit
Mean basal LH and FSH levels were substantially suppressed in both girls and boys at month 3 by triptorelin 6-month PR formulation and remained suppressed at all further visits to month 12 (ITT population; Fig. 4a, b). Mean (SD) basal LH decreased from 2.11 (2.44) IU/L at baseline to 0.36 (0.24) IU/L at month 3, 0.31 (0.28) IU/L at month 6, 0.35 (0.23) at month 9, and 0.29 (0.29) IU/L at month 12 (Fig. 4a). Similarly, mean (SD) basal FSH fell from 4.25 (2.05) IU/L at baseline to 1.16 (0.60) IU/L at month 3, 1.76 (0.87) IU/L at month 6, 1.40 (0.69) IU/L at month 9, and 1.76 (0.62) IU/L at month 12 (Fig. 4b).
Fig. 4
Hormonal suppression at months 3–12. Intention-to-treat population. All data are mean (standard deviation). FSH, follicle-stimulating hormone; LH, luteinizing hormone
In the ITT population, the peak LH levels and FSH levels decreased after treatment with triptorelin 6-month PR formulation (ITT population; Fig. 4c, d). Mean (SD) peak LH levels fell from 27.82 (20.31) IU/L at baseline to 0.98 (0.58) IU/L at month 3, 1.53 (0.89) IU/L at month 6, and 1.26 (0.73) IU/L at month 12 (Fig. 4c). Likewise, mean (SD) peak FSH levels decreased from 13.41 (5.20) IU/L at baseline to 1.56 (0.87) IU/L at month 3, 3.34 (1.69) IU/L at month 6, and 3.24 (1.33) IU/L at month 12 (Fig. 4d).
In the analysis of sex steroids levels, in all participants with non-missing values, sex steroid levels were suppressed to within prepubertal ranges at month 3, 6, 9, and 12 (ITT population; Fig. 5). For girls, mean (SD) serum estradiol decreased from 29.58 (16.38) pg/mL at baseline to lower than 17.94 (0.00) pg/mL (lower limit of quantification, LLOQ). For boys, mean (SD) serum testosterone decreased from 210.38 (241.88) ng/dL at baseline to lower than 11.98 (0.00) ng/dL (LLOQ).
Fig. 5
Proportion of patients with prepubertal levels of sex steroids at months 3–12. Intention-to-treat population. Prepubertal levels of sex steroids were defined as estradiol ≤ 20 pg/mL in girls and testosterone ≤ 30 ng/dL in boys. *Data set has missing values. The number of girls with non-missing values was 60, 54, and 61 at month 3, 9, and 12, respectively, and there was one boy with a missing value at month 9
Clinical EfficacyChanges from baseline in auxological parameters are provided in Table 3. Mean (SD) height (Z-score) was 1.25 (0.79) at baseline, 1.33 (0.78) at month 6, and 1.28 (0.80) at month 12, and mean (SD) percentiles of Z-score were 83.43 (17.97) at baseline, 84.90 (17.00) at month 6, and 83.81 (18.20) at month 12 (ITT population). Changes in mean height from baseline at month 12 were 5.68 (1.13) and 6.68 (0.74) for girls and boys, respectively. Mean (SD) growth velocity decreased relative to baseline (9.82 [5.08] cm/year) in the ITT population; the mean (SD) growth velocity was 5.88 (3.12) cm/year at month 6 and 5.17 (2.47) cm/year at month 12. The overall mean (SD) body mass index (BMI) observed was 17.54 (2.77) kg/m2 at baseline, 17.82 (3.00) kg/m2 at month 6, and 18.79 (3.16) kg/m2 at month 12, and mean (SD) weight increased from 32.59 (7.35) kg at baseline to 34.61 (8.29) kg at month 6 and 37.93 (9.06) kg at month 12 (ITT population). The mean (SD) ratio BA/CA decreased from 1.27 (0.10) at baseline to 1.23 (0.08) at month 6 and 1.21 (0.08) at month 12.
Table 3 Change from baseline in auxological parametersRegarding pubertal stage and gonadal development, breast development stage for girls and genital development stage for boys were stable or reduced in 98.5% of participants between baseline and month 6 and in 93.9% of participants between baseline and month 12 (ITT population; Table 4). Relative to baseline, 98.4% at month 6 and 93.5% at month 12 of girls had regression or stable breast development stage. For breast development stage, the proportion of girls at Tanner scale I, II, III, IV, and V at screening was 1.6%, 42%, 44%, 11%, and 1.6%, respectively, and at month 6 and month 12 the values were 11%, 44%, 37%, 6.5%, and 1.6% and 11%, 48%, 27%, 9.7%, and 1.6%, respectively. All boys had regression or stable genital development at month 6 and 12. In boys, the proportion at Tanner scale I, II, III, IV, and V for genital development stage at screening, month 6, and month 12 was unchanged at 0%, 50%, 50%, 0%, and 0%, respectively. Compared with baseline, pubic hair development stage was stable or reduced in 92.4% of participants at month 6 and in 86.4% participants at month 12 (ITT population; Table 4). At month 6 and 12, 91.9% and 87.1% of girls had regression or stable status of the pubic hair development stage, respectively. All (100%) and three (75%) boys had regression or stable status of the pubic hair development stage at month 6 and 12, respectively. At month 6 and 12, absence of progression compared with baseline of uterine length was seen in 79.0% and 71.0% of girls (Table 4), respectively, and regression of uterine length from baseline was observed in 40 (64.5%) girls. Overall, uterine length decreased from a mean (SD) of 3.16 (0.96) cm at baseline to 2.80 (0.92) cm and 2.77 (0.97) cm at month 6 and 12, respectively. Absence of progression of testis volumes was seen in three (75%) boys and testis volume decreased from a mean (SD) of 11.00 (2.71) mL at baseline to 9.13 (3.38) mL and 9.25 (3.95) mL at month 6 and 12, respectively.
Table 4 Change from baseline in pubertal stage and gonadal developmentSafetyIn the safety population, 59 patients (89.4%) reported a total of 173 TEAEs, all of which were non-serious TEAEs (Table 5). The most frequently reported TEAEs (> 10%) were upper respiratory tract infection (47.0%), COVID-19 (15.2%), pyrexia (13.6%), weight increase (13.6%), cough (10.6%), and overweight (10.6%). Of the 173 TEAEs, 22 events in 13 patients (19.7%) were considered to be drug related. The most frequently reported drug-related TEAEs were weight increase (9.1%), obesity (3.0%), vaginal hemorrhage (3.0%), and hepatic steatosis (3.0%). All TEAEs were grade 1 or grade 2, and no participant experienced a TEAE grade ≥ 3. No TEAEs led to treatment discontinuation, and there were no deaths.
Compared with baseline, laboratory parameters (hematology, chemistry, urinalysis) and vital signs remained stable throughout the study, and no potentially clinically meaningful abnormalities occurred. The triptorelin 6-month PR formulation injections were well tolerated, and no local tolerability reactions were reported.
PK AnalysisFour hours post-injection on day 1, mean (SD) plasma concentration of triptorelin rose to 47.8 (27.2) ng/mL (Table 6 and Fig. 6). At month 3, the mean (SD) plasma concentration of triptorelin was 0.0544 (0.0418) ng/mL, with one patient having a triptorelin plasma concentration below the limit of quantification (BLQ). At month 6, concentrations were BLQ in 15 patients (pre-dose) and the mean (SD) plasma concentration of triptorelin was 0.599 (3.89) ng/mL. Four hours post second injection, the mean (SD) plasma concentration of triptorelin rose to 35.3 (23.3) ng/mL. At the month 12 final follow-up visit, 15 (out of 65) patients had triptorelin plasma concentrations BLQ and the mean (SD) plasma concentration of triptorelin was 0.0284 (0.0314) ng/mL. Individual Ctrough levels showed no accumulation of triptorelin after the second administration.
Table 6 Summary of triptorelin plasma concentrationFig. 6
Spaghetti plot for triptorelin plasma concentration over time. PK set. Base, day 1 (visit 2) pre-dose; D1H4, day 1 (visit 2) 4 h post-injection; M3, month 3 (visit 3); M6PRE, month 6 (visit 4) pre-dose; M6H4, month 6 (visit 4) 4 h post-injection; M12, month 12 (visit 6). The red dotted line is the lower limit of quantification of triptorelin plasma concentration and the value is 0.0100 ng/mL
Comments (0)