
Remember me


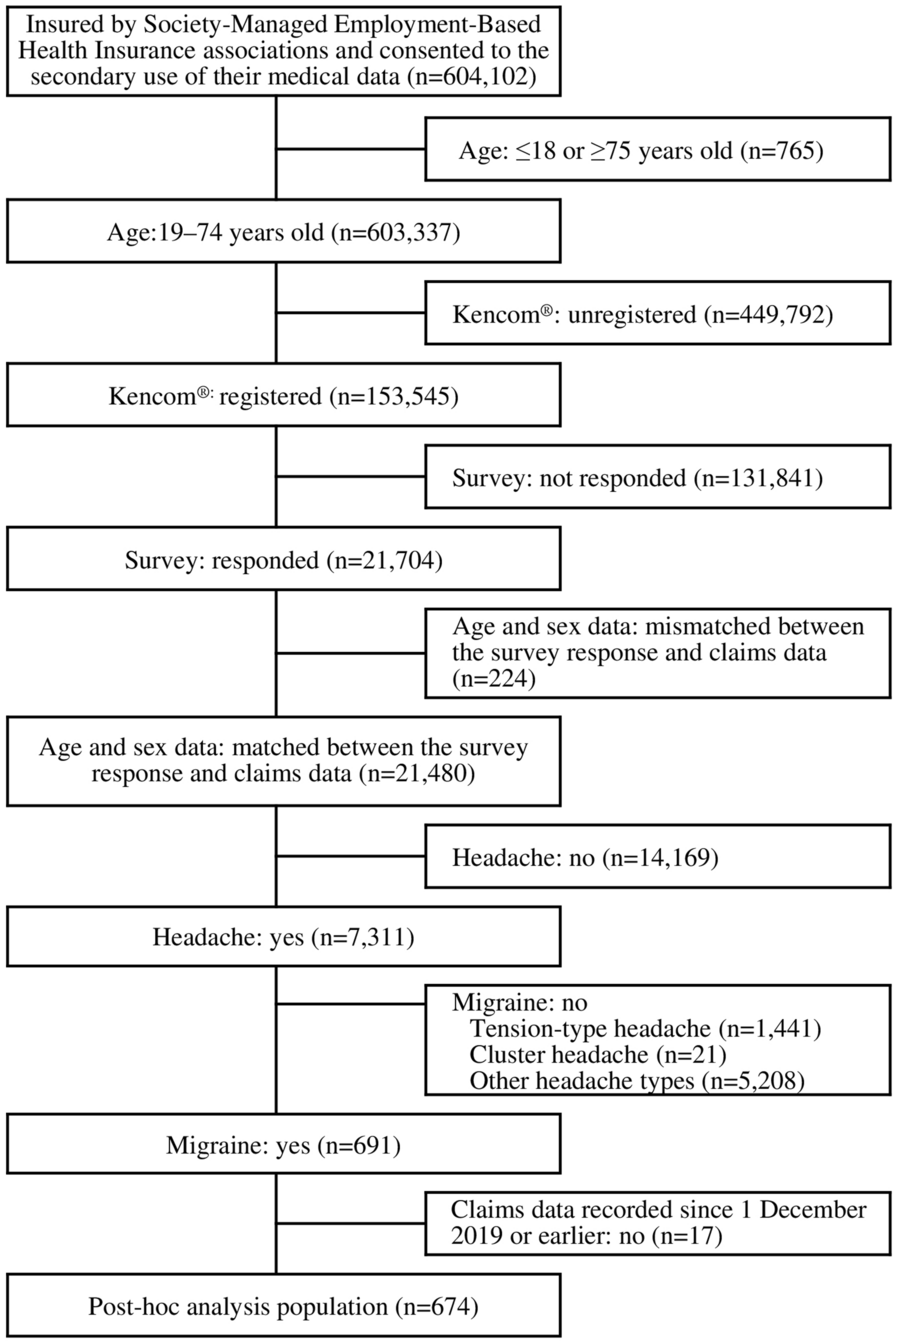

Literature search resulted in 1581 articles, of which 119 underwent full review, and 12 were included in the final analysis (Fig. 1) [10, 14,15,16,17, 21, 31,32,33,34,35,36]. Among the studies included for systematic review and meta-analysis, nine were observational studies [15,16,17, 21, 31, 33,34,35,36], and three were RCTs [10, 14, 32] on children with CPP. The analysis included a total of 657 patients with CPP (age < 8 years in girls and < 9 years in boys). Baseline characteristics of the included studies and their quality scores are summarized in Table 1.
Table 1 Baseline characteristics of the included studiesRisk of BiasJADAD assessment was performed for three studies [10, 14, 32] and NOS scale was used for nine studies [15,16,17, 21, 31, 33,34,35,36]. As per the JADAD scoring (supplementary Table 1), three studies were of low quality [27], while most of the observational studies (NOS scale, supplementary Table 2) were of moderate quality [16, 21, 29, 30].
Efficacy OutcomesPrimary EndpointLH SuppressionMean basal LH Three studies reported the basal LH levels after treatment with LA 11.25 mg 3 M [14, 16, 36]. The mean basal LH levels at baseline across three studies is summarized in supplementary Table 3, and the mean basal LH concentrations decreased to 0.96 IU/l (95% CI 0.96–0.96) and 0.36 IU/l (95% CI 0.30–0.41) at 3 and 6 months, respectively (supplementary Fig. 1). The mean basal LH levels reported in the three studies at months 1, 2, 4, 5, 6 and 12 are summarized in supplementary Table 3. Sensitivity analysis comparing random versus fixed effects suggests numerically higher value for the fixed effects model than in the random effects model 0.68 [0.13, 1.23] at 3 months. However, at 6 months the mean values were 0.36 [0.30; 0.41] for the fixed effect model and 0.54 [0.21; 0.87] for the random effects model.
Mean stimulated LH Eight studies reported the stimulated LH levels after treatment with LA 11.25 mg 3 M [14,15,16,17, 21, 31, 32, 36]. The mean stimulated LH levels at baseline across eight studies are summarized in supplementary Table 4. The mean stimulated LH levels decreased to 1.90 (95% CI 1.80–2.01) and 0.70 (95% CI 0.59–0.81) IU/l at 3 and 6 months and remained low at 12 months (1.43 IU/l [95% CI 1.32–1.54]) (Fig. 2). The mean stimulated LH levels that were reported in the studies at 3 months, 9 months, 2 and 3 years are summarized in supplementary Table 4. The LH levels remained low and were within < 4 IU/l at 3 months, 9 months and 2 years. Sensitivity analysis of the pooled results at 3 months showed that the mean stimulated LH levels were numerically higher in the fixed effect model 1.90 [1.80; 2.01] than in the random effect model 1.81 [1.31;2.32]. At 6 months, the mean value was 0.70 [0.59; 0.81] for the fixed effect model and 1.03 [0.56; 1.49] for the random effect model.
Fig. 2
Forest plot of mean stimulated LH levels after GnRH test (LH < 4 IU/l) at all timepoints. The outcomes for which meta-analysis was not conducted because of a lack of studies were summarized systematically. LH luteinizing hormone; GnRH gonadotrophin-releasing hormone
Proportion of Peak LH Suppression (< 3 IU/l) Five studies reported the proportion of children with peak LH suppression (< 3 IU/l) after treatment with LA 11.25 mg 3 M [14,15,16, 34, 36]. The peak LH suppressions (< 3 IU/l) reported in the studies at 9, 12 and 18 months are summarized in supplementary Table 5. The proportion of children with peak LH suppression (< 3 IU/l) at the 6-month timepoint was 94% (95% CI 81–98; I2 = 36%; P = 0.21) (Fig. 3). Sensitivity analysis of random vs fixed effect models for 3 and 6 months demonstrated that the proportion of peak LH suppression (< 3 IU/l) was similar across both models.
Fig. 3
Forest plot of children with peak LH suppression (< 3 IU/l) at all timepoints after leuprorelin 3M treatment. The outcomes for which meta-analysis was not conducted because of a lack of studies were summarized systematically. LH luteinizing hormone
FSH SuppressionMean Basal FSH Two studies reported the basal FSH levels after treatment with LA 11.25 mg 3 M [16, 36]. The mean basal FSH level at baseline was 3.8 ± 2 IU/l and the mean basal FSH concentrations decreased to < 2 IU/l by 6 months [16] (supplementary Table 6). In the other study [36], the mean basal FSH levels at baseline and 6 months were 4.1 ± 3.5 and 2.0 ± 1.3, respectively.
Stimulated FSH Six studies reported the mean stimulated FSH levels after treatment with LA 11.25 mg 3 M [15, 16, 21, 31, 32, 36]. The mean stimulated FSH levels at baseline across six studies are summarized in supplementary Table 7. The mean stimulated FSH levels at 3 months were 1.9 ± 1.5 IU/l (reported in one study; supplementary Table 7). The mean stimulated FSH levels decreased to 1.35 IU/l (95% CI 1.14–1.56; I2 = 93%; P < 0.01) at 6 months. However, at 12 months, the FSH levels increased to 3.87 IU/l (95% CI 3.35–4.38; I2 = 0%; P = 0.66), but they were within < 4 IU/l (Fig. 4). Sensitivity analysis across different timepoints (3, 6, 12 months) showed that mean stimulated FSH levels were similar across fixed and random effect models. At 3 months, in the fixed effect model, the mean value was 2.40 [2.09; 2.72], and for the random effect model, the mean value was 2.40 [1.42; 3.38]. At 6 months, the mean value was 1.35 [1.14; 1.56] and 1.65 [0.62; 2.68] for fixed and random effect models. At 12 months, the mean value was 3.87 [3.35; 4.38] for both random and fixed effect models.
Fig. 4
Forest plot of mean stimulated FSH levels after GnRH test (FSH < 4 IU/l) at all timepoints. The outcomes for which meta-analysis was not conducted because of a lack of studies were summarized systematically. GnRH gonadotrophin-releasing hormone; FSH follicle stimulating hormone
Secondary EndpointsOestradiol SuppressionMean Basal Oestradiol Seven studies reported the basal oestradiol levels after treatment with LA 11.25 mg 3 M [10, 14,15,16, 21, 31, 36]. The mean basal oestradiol levels at baseline are summarized in supplementary Table 8. The mean basal oestradiol levels were 18.30 pmol/l (95% CI 16.65–19.95; I2 = 99%; P < 0.01) at 1 month, 14.09 pmol/l (95% CI 13.01–15.17; I2 = 99%; P < 0.01) and 14.18 pmol/l (95% CI 13.30–15.07; I2 = 99%; P < 0.01) at 3 months and 6 months, respectively (supplementary Fig. 2).
Basal Oestradiol Suppression Three studies reported the proportion of children with basal oestradiol suppression after treatment with LA 11.25 mg 3 M [10, 16, 36]. In 2023, Huang et al. reported suppressed response to the GnRH test (oestradiol < 73.4 pmol/l) at 12 months after leuprorelin 3 M treatment in 100% (n = 28) of patients. The proportion of children with a suppressed basal oestradiol response (basal oestradiol < 20 pg/ml or 73.4 pmol/l) to the GnRH test at 1 month was 60.0% (95% CI 47–72; I2 = 93%; P < 0.01) and at 2 months and 6 months was 63% and 34% (Fig. 5).
Fig. 5
Forest plot of children with a suppressed response to the GnRH test (oestradiol < 73.4 pmol/l) at all timepoints after leuprorelin 3M treatment. The outcomes for which meta-analysis was not conducted because of a lack of studies were summarized systematically. In Peter A. Lee's study, for basal oestradiol levels, pooled data were used for Months 1–3, whereas for Month 6, only the treatment-naïve group was included because of an outlier in the previously treated group. GnRH gonadotrophin-releasing hormone
Testosterone SuppressionMean Basal Testosterone Three studies reported the basal testosterone levels after treatment with LA 11.25 mg 3 M [10, 16, 31]. The mean basal testosterone levels at baseline are summarized in supplementary Table 9. The mean basal testosterone levels were 1.72 nmol/l (95% CI 1.03–2.40; I2 = 0%; P = 0.45) at 1 month and 0.72 nmol/l at 3 months (95% CI 0.43–1.01; I2 = 0%; P = 0.57) (supplementary Fig. 3). The mean basal testosterone levels at 12 months were 7 ± 4.3 ng/dl (supplementary Table 9).
Basal Testosterone Suppression Two studies reported the proportion of children with basal testosterone suppression after treatment with LA 11.25 mg 3 M [10, 16]. The proportion of children with a suppressed basal testosterone response (basal testosterone < 30 ng/dl or < 1.04 nmol/l) to the GnRH test at 1 month was 51.00% (95% CI 14–86; I2 = 61%; P = 0.11) and at 3 months and 6 months 80% and 71%, respectively (Fig. 6).
Fig. 6
Forest plot of children with a suppressed response to the GnRH test (testosterone < 30 ng/dl or < 1.04 nmol/l) at all timepoints after leuprorelin 3M treatment. The outcomes for which meta-analysis was not conducted because of a lack of studies were summarized systematically. In Peter A. Lee's study, for patients with stimulated/peak testosterone levels, data from both groups (treatment naïve and previously treated group) were combined. Regarding basal testosterone levels, pooling was not performed since the previously treated group lacked a standard deviation (SD). GnRH gonadotrophin-releasing hormone
Height, Weight, BMI, BA-CA Ratio and Growth VelocityHeight Two studies reported the change in height after treatment with LA 11.25 mg 3 M [17, 21]. Compared to baseline, the mean height gain at 6 and 12 months and 3 years was 3.5 cm, 6.10 cm and 16.7 cm, respectively (supplementary Table 10).
Weight Two studies reported the change in weight after treatment with LA 11.25 mg 3 M [21, 32]. Compared to baseline, the mean weight gain at 1, 2 and 3 years was 5.10 kg, 3.10 kg and 14.50 kg, respectively (supplementary Table 11).
BMI Two studies reported the change in BMI after treatment with LA 11.25 mg 3 M [17, 21]. Compared to baseline, the mean BMI gain at 6 and 12 months and 3 years was 17.70, 18.30 and 19.90 kg/m2, respectively (supplementary Table 12).
BA-CA ratio Four studies reported the ratio of bone age to chronological age (BA-CA ratio) after treatment with LA 11.25 mg 3 M [15, 17, 21, 33]. Compared to baseline, the mean change in BA-CA ratio decreased at 6 months and ≥ 3 years to – 0.04 (95% CI − 0.08 to − 0.00) and − 0.26 (95% CI − 0.34 to − 0.18) (supplementary Fig. 4). Jeon et al. [17] (n = 45) reported mean difference in BA-CA at 12 months to be − 0.30 (0.56). This suggests a slowing of bone age as pubertal development is slowed.
Growth Velocity Seven studies reported the growth velocity after treatment with LA 11.25 mg 3 M [14,15,16, 31,
Comments (0)