Study Design
This was a retrospective, propensity score-matched, cohort study that analyzed data from three US claims datasets, Optum’s de-identified Clinformatics® Data Mart Database (Clinformatics®), Merative™ MarketScan® Commercial and Medicare Databases (MarketScan), and IQVIA US PharMetrics® (PharMetrics), employing a common data model.
Data Sources
Clinformatics®, MarketScan, and PharMetrics are extensive, de-identified, longitudinal patient-level claims databases frequently utilized in real-world evidence research. These databases compile claims data gathered throughout the provision of health care services under various insurance programs. The data encompass a broad spectrum of patient-level information, including demographics, diagnoses, procedures, prescription fills, and insurance enrollment details [21,22,23].
Primarily collected for billing purposes, claims data are regarded as a comprehensive and accurate representation of the services rendered within the health care environment. They not only detail the care provided but also the associated costs. Furthermore, because claims data are not confined to services from a single provider, they offer a longitudinal perspective on patient care. This allows for the monitoring of health care resource utilization (HCRU), treatment patterns, and outcomes over weeks or months, as individuals generally remain enrolled in their insurance plans [24, 25]. However, since claims data are primarily intended for billing, they typically lack clinical information such as laboratory values, vital signs, family history of diseases, or the rationale behind clinical decisions [24, 26]. Additionally, claims data may be limited as they only include patients enrolled in some form of insurance coverage, thereby excluding uninsured or underinsured populations [27].
For this study, a sample of patients from Clinformatics®, MarketScan, and PharMetrics was utilized. Each database features a diverse patient population, with clinical and prescription claims that reflect various geographical areas, providers, and therapeutic indications [21,22,23]. Clinformatics® and PharMetrics focus on commercially insured patients [21, 23]. Clinformatics® data also includes information from Medicare Advantage members [28]. The MarketScan data used in this research includes both commercial claims and Medicare Supplemental data, which covers individuals with Medicare supplemental insurance provided by employers, encompassing both medical and drug coverage. This dataset represents a broader range of individuals, including retirees utilizing Medicare benefits [22].
Patients
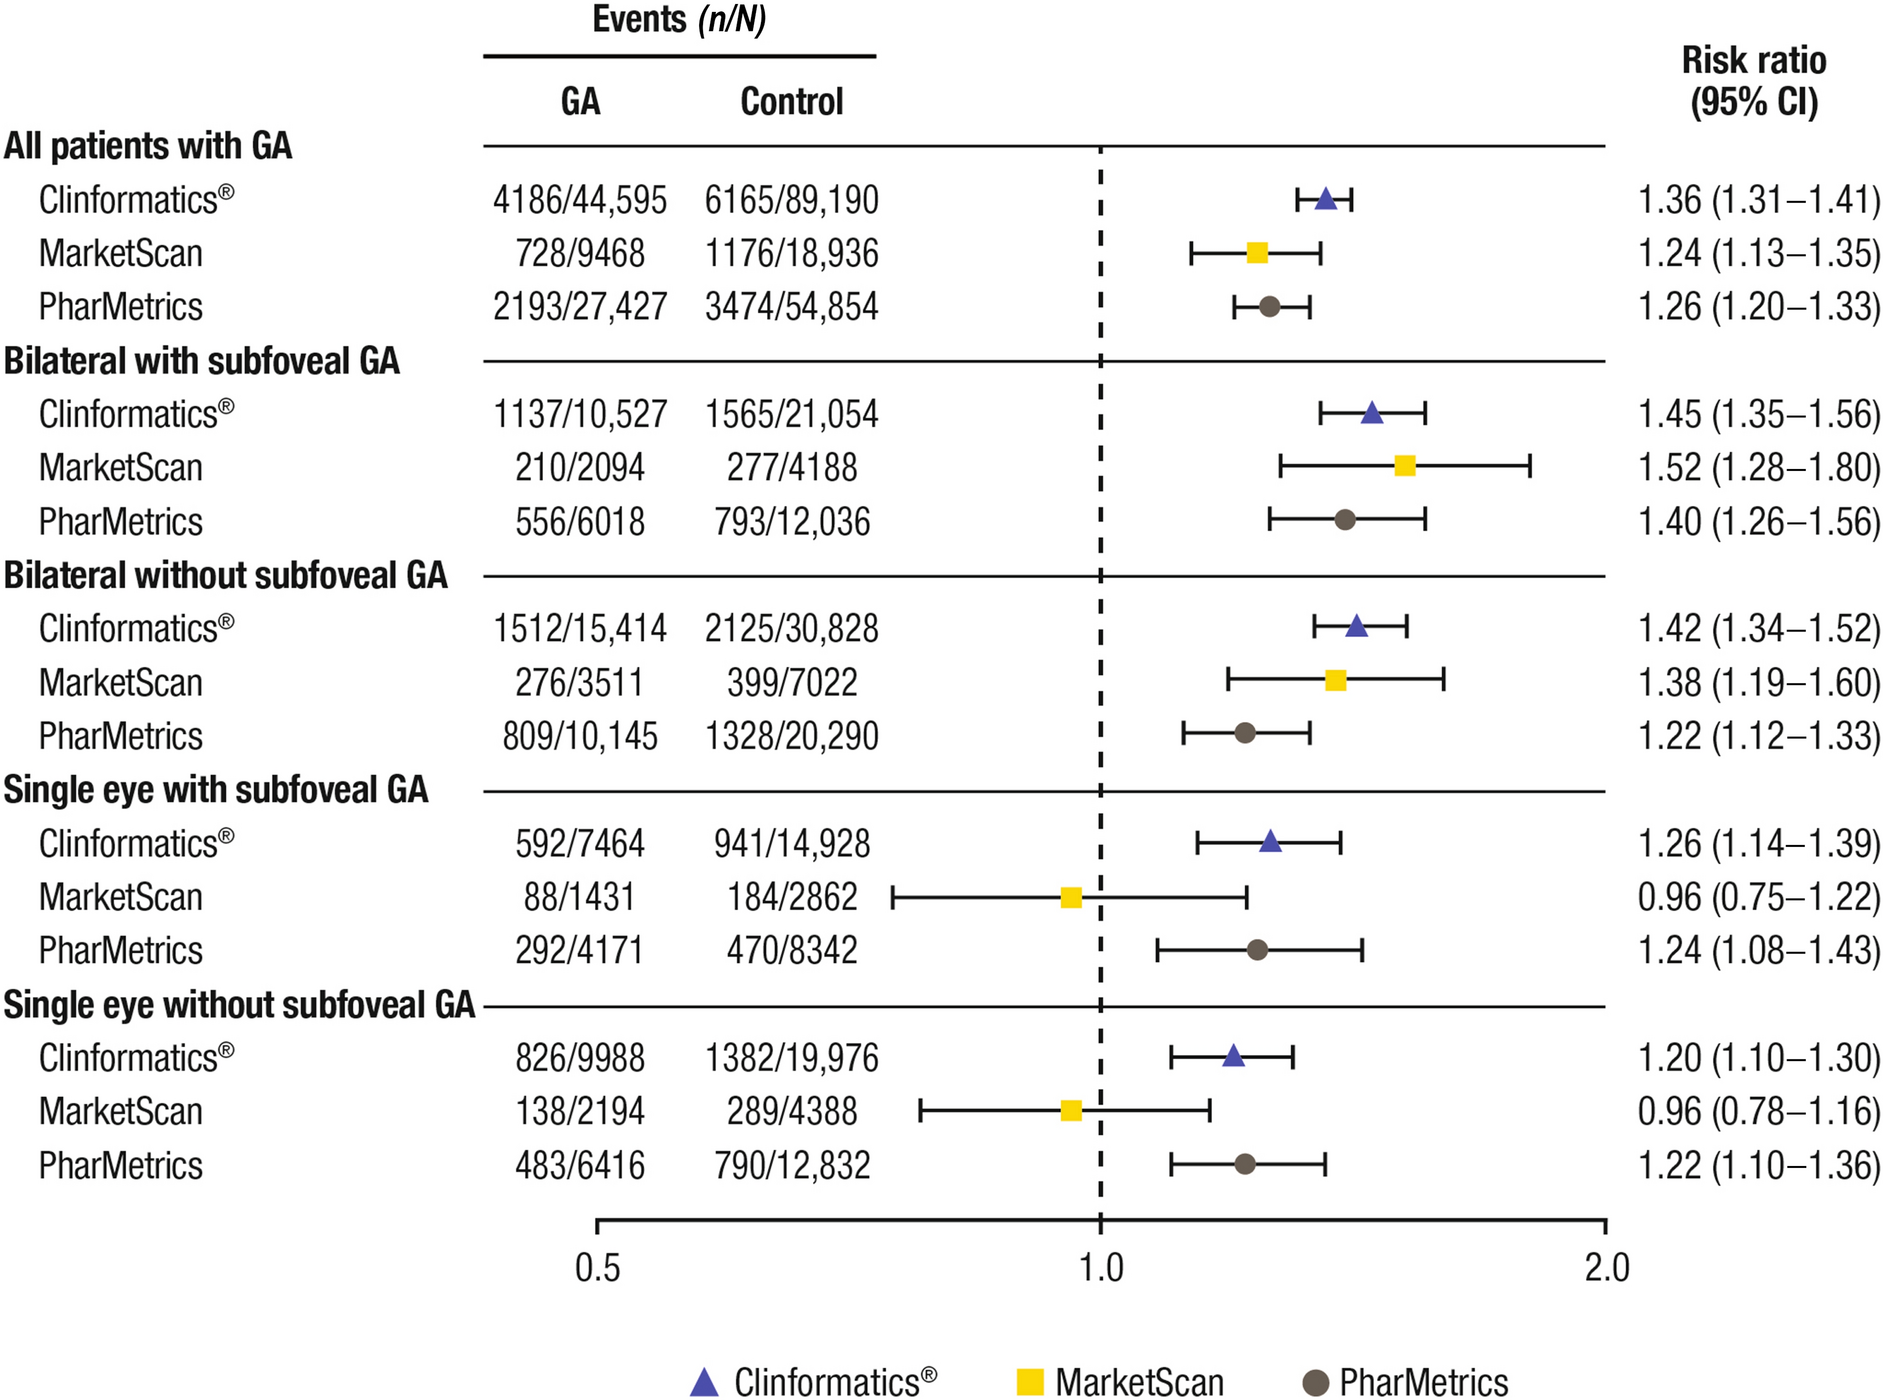
Eligible patients were adults ≥ 50 years of age who had a first diagnosis of GA, according to the International Classification of Diseases, Tenth Revision (ICD-10) codes H35.31x3 and H35.31x4, on or after October 1, 2015. The date of the first GA diagnosis during the observation period was considered as the index date (Fig. S1 in the Supplementary Material). Patients with GA were further classified based on the eye involved and location of lesion (foveal vs subfoveal), as categorized at the index date, for a stratified analysis (Table S1 in the Supplementary Material). Considering the possible misclassification of patients to the subgroups with or without subfoveal involvement, a bilateral with and without subfoveal group was also assessed but not reported here because of the small sample sizes. Continuous enrollment for ≥ 12 months in the specific health plan prior to the index date was also required.
Patients were excluded if they had a GA diagnosis code prior to their index date, diagnosis code of “single eye, with and without subfoveal on index” at any time, a history of wet AMD (International Classification of Diseases, Ninth Revision [ICD-9] diagnosis code 362.52, or ICD-10 diagnosis code H35.32x) prior to GA diagnosis within the entire data window, including the index date, or any indication of regression of GA category.
The matched control cohort was required to be ≥ 50 years of age, have ≥ 12 months of continuous enrollment in their health plan prior to the index date, and not have a diagnosis of GA or AMD in their medical records during the study period (ICD-9 and/or ICD-10 diagnosis codes). Random index dates for the control group were defined using a uniform distribution from 2015 through the end of data. As a result of the large number of patients without GA/AMD within the databases, a sample of 25% was randomly extracted from the overall sample population.
Patients were followed from the index date to one of the following, whichever occurred first: the end date of first enrollment segment post index date, end of study period, 4 years post index date, occurrence of outcome of interest, or death due to any cause. The enrollment window for control cohorts was January 1, 2000 to December 31, 2022 for Clinformatics® and January 1, 2000 to June 30, 2022 for MarketScan and PharMetrics.
Propensity Score Matching
The overall GA population was compared with the overall control cohort, with additional comparisons between each subgroup of the GA population (single eye or bilateral, with or without subfoveal involvement) with an appropriate subset of the control cohort.
Patients with GA were matched exactly in a ratio of 1:2 to controls using a two-tiered approach. Firstly, patients with GA were matched on 5-year age bands (at index date), sex, and index year (Table S3 in the Supplementary Material), and then matched on propensity score using a caliper distance of 0.2. Propensity scores were calculated using a logistic regression model where probability of having GA, as opposed to not having GA or AMD, was conditional based on prior selected patient and clinical characteristics, including age at the index date, sex, smoking history up to and including the index date, selected Charlson Comorbidity Index medical conditions, conditions associated with vision loss (glaucoma, cataracts, diabetic retinopathy), anxiety, depression, admission to a nursing home or assisted living facility within 5 years before the index date, and prior use of an anti-vascular endothelial growth factor medication (which may be used for the treatment of wet AMD) within 5 years before the index date (Table S2 in the Supplementary Material). The “greedy nearest neighbor” algorithm was used for propensity score matching (closest match selected first, then the closest remaining match, until there were no acceptable matches).
Outcomes
The primary outcome was the time after the index date to the first interaction with a health care provider for either depression or anxiety. Patients with depression were identified by a recorded principal diagnosis of depression (i.e., International Classification of Diseases, Ninth Revision, Clinical Modification [ICD-9-CM]: 296.2x, 296.3x, 296.82, 300.4, 309.0, 309.1, and 311; ICD-10-CM: F32.x, F33.x, F34.1, and F43.21). Patients with an anxiety disorder were identified by a recorded principal diagnosis of anxiety disorder (i.e., ICD-9-CM: 300.xx; ICD-10-CM: F40.x-F42.x and F48.9). HCRU was evaluated based on all-cause hospitalizations, emergency department visits, outpatient visits, and use of a nursing home within 2 years of the index event.
Statistical Analysis
Baseline patient demographics and clinical characteristics were summarized using descriptive statistics, including frequencies and percentages for categorical variables, and mean, minimum, maximum, median, interquartile range, and standard deviation for continuous data.
Relative risk (RR) ratios and corresponding 95% confidence intervals (CIs) of depression and anxiety in patients with GA versus controls were calculated using a generalized linear model in R for each follow-up period. Stratified analyses by eye and subfoveal involvement were also conducted.
Sample selection and creation of analytic variables were performed using the Instant Health Data (IHD) software (Panalgo, Boston, MA). Statistical analyses were undertaken with R, version 3.2.1 (R Foundation for Statistical Computing, Vienna, Austria) and SAS Enterprise Guide 7.1 for Windows (SAS Institute, Cary, NC).
Ethical Approval
This study was based on de-identified data collected from three US health care claims databases and did not include human participants; as such, this analysis was exempt from institutional review board oversight and informed consent was not required or obtained.


Comments (0)